A.North American Equity Market Statistics
Canadian Equities
During the first quarter, the Canadian equity market, as measured by the S&P/TSX total return index, increased by 1.3%. Year-over-year, the index increased 14.9%, including dividends. Our basket of Canadian companies (after all expenses) increased by 7.6% during the quarter and by 19.3% over the past 12 months, outpacing the index by a significant margin. Over the past 5 and 10 years, our Canadian businesses have compounded annually at 12.2% and 9%, respectively. When compared to the S&P/TSX we underperformed the index by 2.5% over the past 5 years, but over the last 10 years, we outperformed the index by 1.3%, compounded annually.
Our large weighting in the precious metals royalty companies was the largest contributor to our outperformance. We are pleased with our core positions and their favourable long-term fundamentals. Our direct exposure to tariffs and the escalation of trade tensions remains very small. With heightened concerns around tariffs, we are focused on protecting your capital and being opportunistic, as we enter the second quarter, with stock markets tumbling around the world. In terms of the S&P/TSX index, three of the eleven sub-sectors generated positive returns during the first quarter. The returns of the sub-sectors from highest to lowest are: Materials (+19.3%), Utilities (+3.3%), Energy (+1.0%), Communication Services (-0.2%), Consumer Discretionary (-2.2%), Consumer Staples (-2.6%), Real Estate (-2.8%), Financials (-3.0%), Industrials (-3.3%), Information Technology (-7.0%) and Health Care (-10.0%).
US Equities
During the first quarter of 2025, our portfolio of U.S.-based companies (after all expenses) decreased by 2.4% and, over the past 5 and 10 years, compounded annually at 12.1% and 12%, respectively. During the quarter, we outperformed the S&P 500 index by approximately 1.9% as some of the market darlings gave up some of their gains. The basket of companies we own represent reasonable value and are characterized by strong business fundamentals.
Over the past 5 years, we trailed the S&P 500 index by 6.5% and over the past 10 years we performed in line with the index. When compared to the Dow Jones Industrial Average (DJIA), we outperformed the index by 1.4% and 3.1% over the past 5 and 10 years, respectively. If we look at the Russell 2000, which is a measure of smaller capitalization securities, we outperformed the index by 8% and 7.1% over the past 5 and 10 years, respectively.
In the last couple of years, returns in the U.S. markets have been influenced by a small number of businesses trading at high valuations and propelled by the excitement surrounding artificial intelligence (AI). There is no question that AI will have a significant impact on businesses but that does not give us license to chase overvalued securities and speculate on future returns. If we adhere to our long-term discipline, we will produce the consistent returns demanded by our investors.
Given the size of the U.S. market, most of the new holdings we have added to our portfolios over the past 2-3 years have been global businesses domiciled in the U.S. Expect us to add and substract 2-3 companies from our portfolios each year. In the first quarter, we added one new company to our stable of businesses after an active 2024. That company was Kelly Partners Group Holdings. We have an overview of this company later in our newsletter.
Market Statistics
Pertinent market action during the fourth quarter of 2024 and during the last 12 months is captured in the following table.
| Mar. 31, 2024 | Dec. 31, 2024 | Mar. 31, 2025 | 3 Month Return | 1 Year Return | |
| CAD/USD | $0.7381 | $0.6954 | $0.6951 | -0.04% | -5.83% |
| Oil WTI (US $) | $83.02 | $71.72 | $71.37 | -0.49% | -14.03% |
| Gold (US $) | $2,220.37 | $2,624.50 | $3,123.96 | +19.03% | +40.70% |
| Silver (US $) | $24.87 | $28.90 | $34.06 | +17.85% | +36.95% |
| S&P/TSX | 22,178 | 24,728 | 24,917 | +0.76% | +12.35% |
| S&P 500 | 5,254 | 5,882 | 5,612 | -4.60% | +6.81% |
| Cdn 10 yr. | 3.47% | 3.22% | 2.97% | -25 bps | -50 bps |
| US 10 yr. | 4.20% | 4.57% | 4.21% | -36 bps | +1 bps |
During the first quarter, the Canadian dollar edged lower 0.04% against the USD and was down 5.8% over the last twelve months. Political uncertainty, trade tensions with the US and ten years of destructive economic policies out of Ottawa has seriously damaged the Canadian economy. The wealth gap between Americans and Canadians has grown by over 45% since Justin Trudeau was elected as Prime Minister of Canada. This ongoing underperformance of the Canadian economy has dragged the Canadian dollar down relative to the USD. Given Canada’s weaker economy, the Bank of Canada has lowered interest rates in Canada at a faster pace than the US Federal Reserve, further weakening our dollar relative to the USD. Canada is in desperate need of a new government that will be committed to lower taxes, lower regulations, eliminating inter-provincial trade barriers, building pipelines to our two coastlines and opening up all of our resource sectors to prudent development.
During the quarter, gold was up 19% and over the past twelve months, a whopping 40.7%. It finished the quarter at $3,124. Silver was up 17.9% during the first quarter and increased by 37% over the past year. We believe the long-term trends for both of these precious metals are to the upside and we continue to build positions in this sector. In fact, many of the precious metals mining companies and royalty businesses are attractively valued relative to the price of gold and silver. We believe that these businesses are beautifully positioned to benefit from global turmoil, tariff adjustments, overindulgent governments and rising precious metals prices. The first quarter stock performance of our major positions were as follows: Franco-Nevada (+34%), Gold Royalty (+19.2%), Osisko Royalties (+16%), Royal Gold (+24%), Sandstorm Gold (+34.8%), Wheaton Precious Metals (+38%), and Agnico Eagle Mines (+38.6%).
Few people realize that gold has actually outpaced the S&P 500 total return index over the past 25 years! The annual compound rate of growth in the price of gold over the past 25 years and 3 months is 9.87%. (Gold traded at $290 on January 1, 2000 and closed at $3,124 on March 31, 2025). The S&P 500 over the past 25 years has an annual compound rate of growth of 7.76%! What can we learn from this comparison? It teaches us that the last 25 years, which have been characterized by excessive financialization, money printing, massive debt accumulation and repressive interest rate polices don’t create broad and sustaining wealth. Gold acting as a sleuth was not fooled by all these shenanigans.
The chart below (updated to April 1, 2025) gives you a breakdown of the performance of gold bullion versus the major currencies in the world1 over the past 15 years. If you look at the third column and go down to the bottom you can see that gold averaged 9.7% per year in Canadian dollars. This is actually a much better barometer of inflation. Since gold is money and over long periods of time maintains purchasing power, you can see that in Canada, our dollar has been losing more than the government’s reported inflation rate of 2-3% per year over the past 15 years. If you want to know why things are a lot more expensive than the government is disclosing to you through their less-than-honest CPI (Consumer Price Index) calculations, then just look at how gold is performing over a 10-15 year period for a more accurate, albeit, not perfect measure.

The next chart looks at how many ounces of gold was needed to buy the average home in Canada over the span of 7.5 decades. This is a great way to measure our purchasing power over an extended period. Gold has historically been a stable store of value, unlike fiat currency (i.e. Canadian dollar), which can lose value due to inflation or monetary policy changes. By measuring home prices in terms of gold ounces rather than dollars, you get a clearer picture of how the real purchasing power of wealth has shifted over decades, stripping away the effects of currency devaluation.
Home prices in dollars often rise due to inflation, but this doesn’t necessarily reflect an increase in “real” value since it is measured in fiat currency. Gold, being a tangible asset with limited supply, tends to hold its intrinsic value better over time. Comparing home prices to gold reveals whether homes are genuinely becoming more expensive relative to a consistent benchmark, rather than just reflecting inflated dollar amounts. What you see is that in periods where you need less ounces of gold to buy a home these are times when real money (gold) is more valuable and fiat currency is losing value.
The 1980s was the best time to buy a home with real money (gold) due to higher levels of inflation which elevated the value of gold relative to fiat currency. At the end of 2024, the number of ounces of gold needed to buy the average home continued to trend lower indicating weakness in our fiat/paper money.
In Canadian dollar terms, the value of real estate has increased significantly but that is because we value our homes using a declining fiat currency backed by nothing but the worthless promises of an incompetent and increasingly corrupt State. The average home in Canada in 1975 was $39,500 and the price of gold on December 31, 1975 closed at $142.70 CDN. That means it took 273 ounces to buy the average Canadian home in 1975. Fast forward to 2024. The average home price across the country was $700,000 and gold closed the year at $3,774 Cdn per ounce. That means you only needed 185 ounces of gold to buy the average home in Canada. Think about this for a moment. The price of a home in Canadian dollars went up by 1,672% ($39,500 to $700,000) and yet the amount of gold you needed in real ounces decreased by 32%! The value of our money continues to fall and standards of living in Canada continue to erode. This is one reason why we invest in businesses operating in the precious metals sector. It’s all about trying to maintain and grow our purchasing power when we are governed by an increasingly totalitarian State that is destroying our economy and depreciating the value of our money through reckless fiscal and monetary policies.

During the quarter, the oil price decreased slightly by 0.49%, while year-over-year oil was down by 14%. During the first 9 days of April, oil prices have dropped by another 20%! With the new tariffs and concerns over economic growth, the price of oil is looking for a bottom. With the election of Donald Trump, we anticipate a significant increase in the exploration, development and production of oil and gas in the US. We believe this will keep a lid on the prices of oil and gas for the next few years. As a result, our direct exposure to the sector is very low. Currently, our direct investments in the oil and gas sector remain relatively small (less than 1% of our total assets).
During the first quarter, interest rates dropped significantly as concerns over inflation started to wane and concerns over slowing growth in the eonomy took over. The 10-year Canadian bond yield decreased by 25 bps and the US 10-year Treasury yield decreased by 36 bps during the quarter. Year-over-year, the yields are now down by 50 bps on the 10-year Canadian 10-year bonds but up 1 bp on the US 10-year bond. During the first 9 days in April, rates have reversed and started to edge back up. Concerns over tariff inflation and the funding of the US deficit, along with the debt that is rolling over, is concerning markets.
Many of our investors have asked us about how we manage currency risk. Our answer remains the same—the best way to minimize currency risk is to buy strong and growing businesses that generate revenue in numerous currencies and are backed by hard, tangible assets. As a result, these businesses create a natural currency hedge in your portfolio and mitigate the impact of fluctuating currencies and inflation. Our largest currency exposure in our equity portfolios is the US dollar. When it comes to interest bearing securities/fixed income, our largest currency exposure to the Canadian dollar.
B. ROCKLINC Investment Update
Private Client Assets – Separately Managed Accounts
In terms of our ROCKLINC separately managed accounts, they increased by 1.7% during the first quarter, and by 11.2% during the last year (period ending March 31, 2025). More importantly, our average annual compound rate of return over the past 3, 5 and 10 years is clocking in at approximately 4%, 8.5% and 7.2%, respectively. Returns are after all fees, and are based on an asset mix of approximately 67% invested in equities, with the remainder invested in short-term deposit accounts and short-term bonds. Please note that the performance we are disclosing is our aggregate performance across all our accounts. Each client’s portfolio is unique and performance will vary, based on your risk tolerance and your specific asset allocation.
When we dig further into our numbers, we find that our basket of equities (Canadian and U.S.) were up by approximately 2.75% during the first quarter and up by approximately 15.4% during the past 12 months. Our equities have been compounding by approximately 12.2% over the past 5 years and by 10.0% over the past 10 years, keeping pace with the major indexes.
We continue to focus on the economic fundamentals of the businesses we own. This means that we first, selectively add companies as our research team ferrets out new opportunities. Second, prune underperforming businesses. Third, take advantage of market swings and add to existing positions at better prices!
Throughout 2024, we were very active and added six new positions and while eliminating four. During the first quarter of 2025 we added one new position to our accounts, Kelly Partners Group. This company is highlighted later in this newsletter.
ROCKLINC Partners Fund
Over the past three years, we have been utilizing the Partners Fund in more of the portfolios we manage. The Fund offers our clients a low cost and efficient way to purchase our top 20-25 companies in one portfolio. It is an effective way to gain access to a global diversified portfolio with modest amounts of investment capital. Our number one objective is to create a Fund comprised of excellent companies that produce strong long-term performance.
Quarterly, we provide a performance update to our clients. Performance numbers are after all fees and rates of return beyond one year are annual compound rates of return. Currently, the Fund is 22% in cash and short-term money market instruments (yielding 2.5 – 3%), 77% in publicly traded equities and 1.0% in one private equity investment. We expect our cash weighting to remain in the 20-25% range given market valuations and volatility created by the Trump tariffs. We finished the quarter with $52 million in total assets, up from $46 million at the beginning of the year.
After a very active 2024, our pace of transactions started to normalize during the first quarter of 2025. During the quarter, we sold two businesses—MEG Energy and Progressive Corp—and added one new business, Kelly Partners Group. As new money flows into the Fund, we will add to existing positions based on the valuations of the companies in the portfolio.
After all expenses, the ROCKLINC Partners Fund has been compounding at approximately 7.5% per year since inception (seven years) and 9.1% over the past five years.
When you look through to the equities in the portfolio, the Canadian stocks have been compounding at 11.8% and the U.S. equities have been compounding at 12.4% over the past five years.
Our top 12 holdings represent approximately 62% of the total portfolio and 79% of the equity weighting in the portfolio. The top 12 holdings are Trisura Group (8.3%), Brookfield Corporation (8.2%), Markel Group (7.8%), Wheaton Precious Metals (5.5%), Franco-Nevada (5.4%), Kelly Partners (5.0%), Amazon (5.0%), Burford Capital (4.2%), Roper Technologies (3.6%), Sandstorm Gold Royalties (3.6%), Apple Inc. (2.8%), and Schneider Electric (2.7%).
As at March 31, 2025
| 3 mos. | 6 mos. | 1 yr. | 3 yr. | 5 yr. | Inception* | |
| RL Partners | 0.7% | 5.4% | 11.1% | 4.1% | 9.1% | 7.5% |
ROCKLINC Kokomo Fund
In November 2022, we launched our ROCKLINC Kokomo Fund in order to assist some of our clients and provide them with an investment product that is regulated and registered outside of Canada. Our Kokomo Fund is registered in the Cayman Islands and all funds are held in custody in Grand Cayman. It is important to point out that the Cayman Islands are a British Overseas Territory and the world’s number one offshore market for investment funds.
The Fund Custodian for the ROCKLINC Kokomo Fund is FundBank, the Fund Administrator is SGGG Fund Services (Cayman) Inc., the Fund’s legal counsel is Carey Olsen, and Fund’s Auditor is Grant Thornton (Cayman). The minimum investment is $100,000 USD. The Net Asset Value (NAV) of the Fund is priced monthly and started at $100.00 per unit. We are managing the portfolio in a similar manner to how we manage all our discretionary accounts. This will include 20-25 stocks, low turnover, a competitive management fee, no performance fees and monthly pricing and liquidity. Offering documents are available on our website or by calling us at ROCKLINC.
We started making investments in the portfolio in February 2023 and continue to add slowly to our core positions. As at March 31, 2025, the Fund had a total value of approximately $6.8 million USD. The units closed at 108.98 up 0.25% for the first quarter. There has been a consistent flow of money into the Fund providing us with opportunities to add to our existing positions, trim underperforming businesses, and add new positions to the portfolio. Client interest is strong and we are continuing to add new clients into the portfolio on a regular basis.
As of March 31, 2025, we have 19 equity positions in the portfolio representing approximately 80% of the total value of the assets. The remaining 20% is invested in a money market fund currently earning approximately 4.5% per year. Our objective is to keep the number of equities in the portfolio around 20 and not more than 25, and increase the equity weighting up to 85-90% based on buying opportunities and valuations. We are patiently adding to our equity weights, while keeping cash on the sidelines.
We were very active in the portfolio throughout 2024. In total, we eliminated seven positions and added six new businesses to the portfolio. During the first quarter we added one new position, Kelly Partners Group. For more information on this company, refer to the write-up in this newsletter.
Our top 10 companies in the portfolio by portfolio weighting are Trisura Group, Brookfield Corporation, Wheaton Precious Metals, Markel Group, Roper Technologies, Burford Capital, Osisko Royalties, Franco-Nevada, Amazon and Brookfield Infrastructure. These businesses represent approximately 58% of the total portfolio and 73% of the active equity weighting in the portfolio.
C. Company Update – Kelly Partners Group Holdings Ltd. (KPGHF)
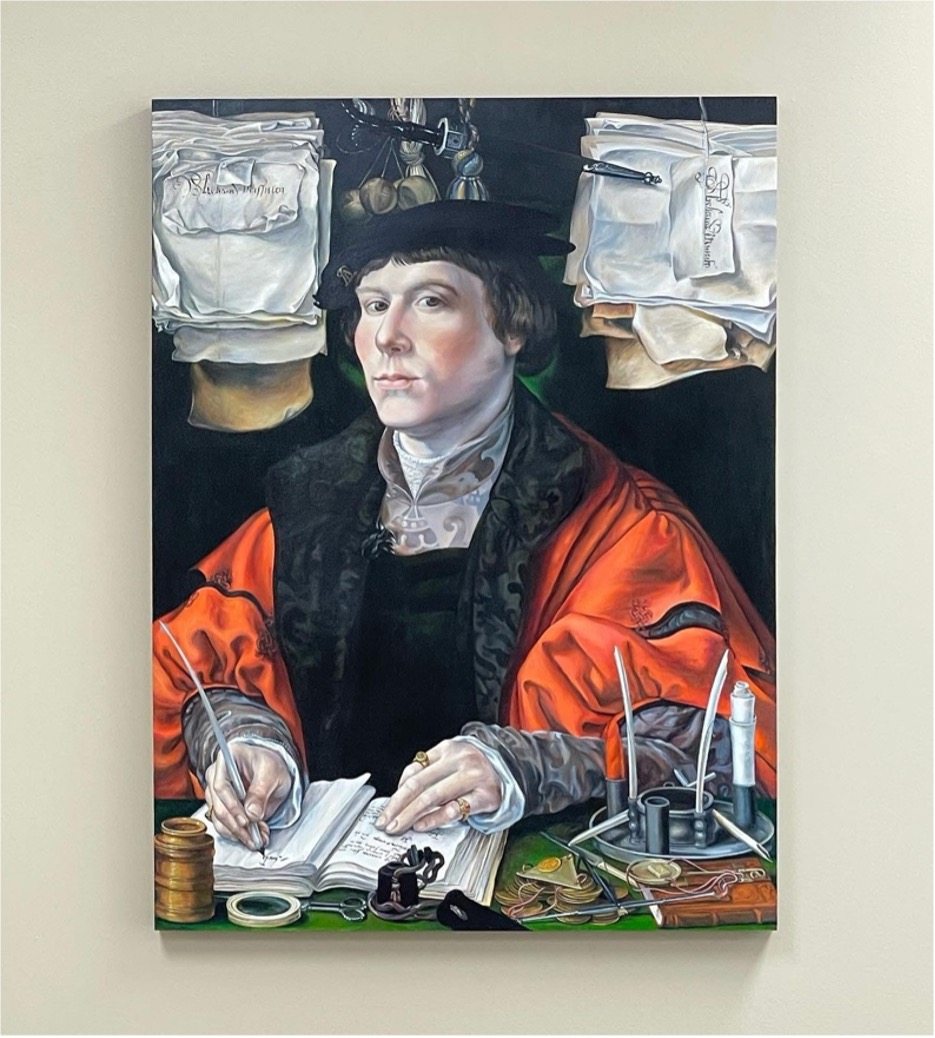
Many of our clients will know that at ROCKLINC, we admire beautiful works of art. If you’ve ever visited our office, you may have noticed a remarkable piece proudly displayed in our boardroom—a commissioned work by the talented artist Susan Outlaw, who masterfully reproduced Jan Gossaert’s classic “Portrait of a Merchant,” originally painted in 1530 and currently housed at the National Gallery of Art in Washington, DC. Gossaert’s portrait depicts a merchant seated in a cramped yet cozy space, recording what appears to be entries in a ledger or book, surrounded by the tools of his trade. We chose this painting to represent a typical finance office 495 years ago, illustrating how much has changed over the centuries—and how some things have remained the same.
In sixteenth-century Europe, merchants played a pivotal role in establishing trade networks across the continent during a period of growing wealth and the emergence of a more capitalist economy. They facilitated the buying, selling, and distribution of goods both domestically and internationally, and much like bankers today, they frequently lent and exchanged money. These extensive long-distance trade activities contributed to the early globalization process. Merchants were responsible for overseeing numerous transactions, which necessitated the maintenance of ledgers that tracked debts, credits, and inventory—a precursor to modern accounting practices. Despite their significant contributions to the economy, merchants were often viewed with suspicion and trepidation. Merchants, financiers, and tax collectors were widely regarded with disdain due to rampant abuses and their association with extortion and greed.
In many ways, the accounting industry today carries echoes of this merchant-like ambivalence. While recognized for its vital contributions to the economy, it has long struggled with a reputation tarnished by instances of fraud and scandal, which have at times destabilized markets and eroded public trust. Compounding this challenge, accounting firms are often seen as unengaging workplaces, contributing to a low employee morale and declining interest in the profession. In the U.S., the number of candidates who sat for the CPA exam in 2022 fell to a 17-year low. Between 2020 and 2022, the number of bachelor’s degrees in accounting dropped nearly 8%, continuing a downward trend since 20181. The path to becoming a CPA is lengthy and expensive, requiring years of education, exams, and work experience. The combination of rigorous requirements, comparatively low starting salaries, and a demanding certification process has deterred many prospective accountants.
This talent shortage is expected to worsen, as 75% of certified public accountants are projected to retire or be near retirement within the next 15 years, according to the American Institute of CPAs. Despite their fundamental role in every organization—providing critical transparency into business operations—accountants are often undervalued and underappreciated. Accounting firms, while inherently good businesses, are often poorly managed. Below the partner level, misaligned incentives create significant challenges, leading to high turnover and a lack of loyalty. Large global firms have struggled to foster an appealing environment for young, ambitious talent. Their reluctance to embrace innovation and adapt to evolving workforce expectations has only exacerbated the issue.
Recognizing the untapped potential for transformation within the industry, Brett Kelly, founder of Kelly Partners Group Holdings, has set out to build an accounting firm that accountants want to be part of—one driven by a mission to help both accountants and their clients be better off.
Brett grew up witnessing firsthand the devastating impact of poor financial advice. His father, an honest and hardworking business owner, placed his trust in an accountant who embezzled money from his business. The betrayal left a profound impression on Brett. Initially on the path to becoming a lawyer, he pivoted to accounting—driven by a mission to build a firm founded on trust, integrity, and a genuine commitment to clients’ financial well-being. Brett earned a degree in business from the University of Technology in Sydney Australia, followed by a master’s degree in taxation from the University of New South Wales. He became a Chartered Accountant and began his professional career at Price Waterhouse, where he worked for over four years, progressing from a junior accountant to a senior accountant.
At just 22 years old, after being laid off from an investment banking role where he was told he “didn’t fit in,” Brett embarked on an ambitious project. He reached out to some of Australia’s most prominent figures—including former Prime Minister Bob Hawke and businessman Malcolm Turnbull— interviewing them about their journeys to success. The result was Collective Wisdom, a book that became a national bestseller despite having no prior experience in publishing. This endeavor not only established Brett as a driven entrepreneur but also reinforced his belief in the power of learning from others—an insight he recognized could transform and potentially redefine the accounting industry.
One of the individuals Brett learned a great deal from was Warren Buffett, whose disciplined approach to investing left a lasting impression on him. Buffett built his wealth over the long term by owning a portfolio of high-quality businesses led by honest and hardworking owner-operators. Inspired to create his own version of a Berkshire Hathaway in the accounting industry, Brett took the leap in 2006 and founded Kelly Partners Group Holdings (KPG)—a holding company focused on building partnerships with strong owner-operators of accounting firms serving private business owners and families. Driven by a vision to create the kind of accounting firm he wished his father had encountered, Brett established Kelly Partners Chartered Accountants, and under his leadership, the firm has expanded rapidly.
In June 2017, Kelly Partners Group Holdings Ltd. was listed on the Australian Stock Exchange. Over the past 18 years the company has expanded from a single office to over 35 locations across Australia, the U.S., Hong Kong, and India, employing more than 600 team members and supporting over 23,000 small to medium-sized business owners, high-net-worth individuals, and families.
Kelly Partners has always focused on serving small, independently owned accounting firms, which face numerous ongoing challenges due to their size and scale. Founding partners often struggle to balance client needs with complex back-office operations, making it difficult to remain competitive and position themselves for growth. The increasing complexity of tax compliance continues to burden small business owners, who are leaning more heavily on their accountants for advice. At the same time, the accounting industry is grappling with a growing talent shortage. According to Bloomberg Tax, the number of accountants and auditors employed declined by 17% between 2019 and 2021. Imagine the amount of stress these owners must endure.
As a result, many founders resort to selling their practices to private equity firms, which often prioritize short-term objectives—such as rapid expansion, organizational restructuring, and financial returns—over preserving the valuable client relationships built over decades. In the United States, private equity has been increasingly involved in the accounting industry and is anticipated to own up to ten of the thirty largest accounting firms in the coming years, with plans to expand their operations globally.2
Unlike private equity’s short-term tactic, KPG’s approach is strategic and purposeful. Their objective is to extend the operating life of these accounting firms by preserving the deep client relationships through partnership rather than complete takeover. Focusing exclusively on small-sized firms specializing in tax and accounting services to private small and medium enterprises, KPG targets firms generating $2–$10 million in revenue, acquiring a 51% equity stake while the founding partners retain the remaining 49%.
Kelly first takes over the back-office functions such as marketing, IT, HR, and operations, all for a fixed percentage fee based on revenue. This fee is reinvested into KPG’s operating businesses to improve administrative functions and adopt better technology, maximizing efficiency. In addition, KPG works with some firms to implement a clear succession plan for aging business owners. As a result, these firms are better positioned for long-term growth, gaining a substantial competitive advantage over firms that simply extract profits annually.
Within the initial years of a partnership, Kelly typically doubles a firm’s profits, raises the earnings margin from approximately 18% to over 30%, and reduces the firm’s working capital requirements by two-thirds. As a result, founding partners are now able to dedicate 100% of their time to revenue-generating activities while they continue to build equity in their business, as Kelly supports the firm from the bottom up. Since Kelly’s IPO in 2017, the company has delivered an impressive 37% compounded annual return to its shareholders and has compounded book value per share and revenue at a similar rate.
After establishing Kelly Partners as a high-quality accounting firm in Australia, Brett’s vision is to replicate that success and expand his passion globally. By focusing on the United States market, which is approximately ten times larger than Australia’s, Kelly has begun partnering with firms across several states like North Carolina, Florida, Texas, and California, which has the largest population of Australian expatriates in the country. Like Australia, the United States is also witnessing a strong demand for Kelly’s partnership model. The small accounting firm market in the U.S. is highly fragmented and grapples with similar challenges that Kelly believes the firm can capitalize on. The expansion aligns with a U.S. public listing, offering increased access to capital to facilitate this growth. It also shares Kelly Partners’ success story with a broader pool of eager investors.
With only one other publicly traded accounting practise in the U.S. and private equity firms eager to deploy their short-term, mission-less approach, Kelly Partners has significant white space to grow. With a market value of approximately $330 million, KPG is a smaller holding relative to our other remarkable businesses. However, its recurring nature of services, coupled with the increasing tax complexities imposed by governments on the private sector, and the ongoing succession issues that must be addressed, all bode well for the business’s long-term success and we intend to build a substantial position in the business for the long-term.
D. Moving Forward
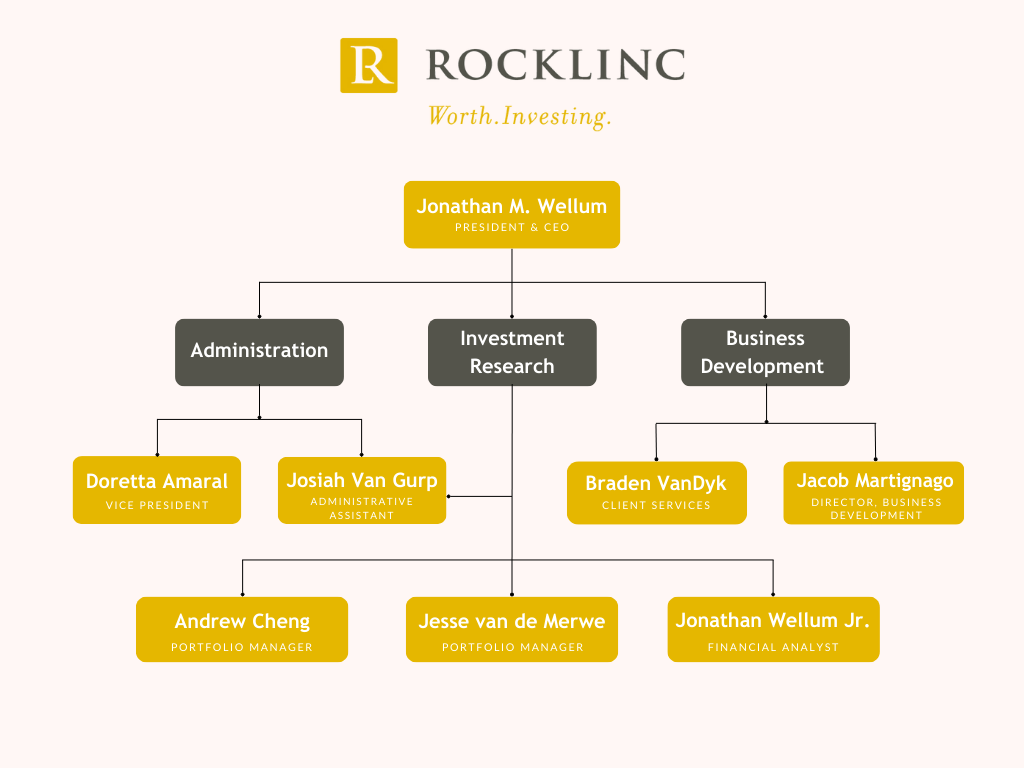
We continue to keep our eyes focused on the fundamentals of the businesses we invest in, within the context of a struggling global economy. We will do our best to take advantage of sharp moves in the market! During 2024, we added another full-time employee to our team, Josiah Van Gurp. Josiah is splitting his time between administration and investment research. We now have eight full-time employees. Here is our organizational chart.
The investment team at ROCKLINC is working hard to make sure our existing companies are performing as expected or better and searching for new companies that we can add to your portfolios. During 2024, we were more active than normal adding nine new businesses to our portfolios and eliminating more than eleven positions.
Within the current environment our basic strategy has not changed due to tariffs and increased trading tensions we continue to create portfolios of excellent businesses. Here are 10 points that capture our basic strategy.
1
Patience – we need to wait for well-priced opportunities. Our patience and cash positions give us the flexibility to buy low. The tariff fallout remains fluid, promising volatility ahead. For our investors, this economic chess game requires discipline. There is going to be a lot of short-term noise which will lead to long-term opportunities. Quality companies at great prices will reward investors who stay focused on the fundamentals and not the headlines.
2
Watch the world’s leading Central Banks. Monetary policy has a direct impact on stock market valuations.
3
Governments continue to run massive deficits that are not sustainable. This means out purchasing power will remain under pressure and standards of living will continue to drop. At some point, deficits and debts will matter and we want to be protected as much as possible from this risk. As a result, we continue to own significant positions in precious metals.
4
Diversify across asset classed, sectors and geographic regions. While we run focused portfolios (20-30 securities), we are also careful to maintain an appropriate level of diversification.
5
Invest in businesses with strong balance sheets, backed by hard and tangible assets with limited counterparty risk.
6
Invest in firms that produce essential products and services, in growing industries, with well-established long-term secular growth trends. Our highlighted company this quarter Kelly Partners Group is an excellent example.
7
Avoid/minimize highly leveraged financialized firms that have incomprehensible balance sheets, loaded with risky derivatives. We continue to minimize our exposure to banks and life insurance companies!
8
Maintain adequate liquidity in our portfolios, in order to take advantage of significant moves in the stock market. Cash is not trash when the markets become irrational! Our cash investments are earning approximately 4.00% per year.
9
Remain positive and opportunistic, seasoned with a dose of reality and rooted in truth.
10
Place your faith and hope in God. As the apostle Paul reminds us in Philippians 4:6, “Do not be anxious about anything, but in everything by prayer and supplication with thanksgiving let your requests be made known to God.”
If you have any questions pertaining to your account, please call or email for an appointment.
ROCKLINC INVESTMENT PARTNERS INC.
Contact Information
ROCKLINC INVESTMENT PARTNERS INC.
4200 South Service Road, Suite 102
Burlington, Ontario
L7L 4X5
Tel: 905-631-LINC (5462)
www.rocklinc.com
| Doretta Amaral | damaral@rocklinc.com | (ext. 1) |
| Jonathan Wellum | jwellum@rocklinc.com | (ext. 2) |
| Jesse van de Merwe | jvandemerwe@rocklinc.com | (ext. 3) |
| Braden Van Dyk | bvandyk@rocklinc.com | (ext. 4) |
| Andrew Cheng | acheng@rocklinc.com | (ext. 5) |
| Jacob Martignago | jmartignago@rocklinc.com | (ext. 6) |
| Jonathan Wellum Jr. | jwellumjr@rocklinc.com | (ext. 7) |
| Josiah Van Gurp | jvangurp@rocklinc.com | (ext. 8) |
Disclaimer