A. The Vital Role of Free Speech: Safeguarding Democracy and Economic Prosperity Against Growing Censorship
In an age where authoritarian laws masquerade as protective measures, free speech stands as the bedrock of both democratic societies and thriving economies. Without the unfettered exchange of ideas, governments grow unaccountable, innovation stagnates, and prosperity falters. This is particularly evident in Western nations, where free speech has been steadily eroded. In Canada, under the Liberal government since 2015, a series of laws have incrementally curtailed free expression, culminating in the proposed Bill C-9, the Combatting Hate Act. This legislation, which amends the Criminal Code on hate propaganda and crimes, broadens definitions of “hate,” removes religious exemptions, and risks criminalizing dissent, religious views, and peaceful protests. By briefly examining free speech’s foundational role in democracy and the economy, we can see why such restrictions threaten our freedom and our economic growth and prosperity.
Free Speech as the Pillar of Democracy
First, free speech enables open debate and the marketplace of ideas, essential for informed decision-making in a democracy. Philosopher John Stuart Mill argued that truth emerges from the collision of opinions; suppressing views, even erroneous ones, hinders societal progress. In democratic systems, citizens must critique policies, challenge norms, and propose alternatives without fear of reprisal. When governments like Canada’s impose vague “hate speech” laws, they create chilling effects, where individuals self-censor to avoid legal jeopardy. Bill C-9 exacerbates this by expanding hate propaganda definitions to include symbols and expressions, potentially stifling political discourse on sensitive topics like immigration or cultural practices and putting more power in the hands of the State.
Second, free speech holds those in power accountable, preventing corruption and authoritarian drift. Real journalists, those that are not subsidized by the State, and ordinary citizens expose wrongdoing through whistleblowing and public criticism. Historical examples abound: in Canada, free speech has revealed numerous government scandals, such as the Trudeau Cash-for-Access affair in 2016, the SNC-Lavalin affair in 2019 and the Nursing Home Negligence scandal during COVID in 2020, just to name a few. However, since 2015, the Liberal government has passed laws like Bill C-11 (regulating online content) and Bill C-63 (the Online Harms Act), which empower regulators to monitor and penalize “harmful” speech. Bill C-9 builds on this by granting authorities broader powers without sufficient oversight, risking abuse against opposition voices and eroding trust in institutions.
Third, free speech protects minorities and fosters social tolerance, counterintuitively strengthening democracy. By allowing even unpopular views to be aired, societies can address grievances through dialogue rather than violence. Suppressing speech drives ideas underground, breeding resentment. In Canada, restrictions like those in Bill C-9—removing defenses for religious beliefs under hate speech laws—is an attempt to silence faith-based communities, especially Christians from quoting Scripture and proclaiming the Christian gospel, which is a threat to totalitarian States attempting to usurp the position of God. Critics, including even civil liberties groups, warn this could criminalize peaceful assemblies, undermining the Charter of Rights and Freedoms’ guarantees which have already been undercut repeatedly by a left leaning court system.
Free Speech as the Engine of Economic Vitality
Shifting to the economic realm, free speech first drives innovation by facilitating the free flow of information and ideas. Economies thrive on creativity: entrepreneurs pitch ventures, scientists share breakthroughs, and markets adapt through feedback. Silicon Valley’s success stems from an environment where ideas are debated openly, unhindered by censorship. In contrast, restrictive regimes like China’s Great Firewall limit access to global knowledge, hampering technological advancement. In Canada, Bill C-9’s broad hate definitions could deter discussions on controversial innovations, such as AI ethics or resource extraction and development, stifling startups and research which are already suffering from lack of funds, enterprise and top talent.
Second, free speech ensures efficient markets by promoting transparency and consumer choice. Investors rely on uncensored financial analyses, whistleblowers reveal corporate fraud, and consumers benefit from honest reviews. Adam Smith’s “invisible hand” presupposes informed participants; censorship distorts this, leading to bubbles and inefficiencies. Western economies have historically outpaced others due to open discourse—think of the U.S. stock market’s robustness versus censored economies like Russia’s, and now the UK and large parts of Europe. In Canada, where natural resources and tech sectors are key, laws curbing speech since 2015 have already turned away hundreds of billions of dollars in investment. Bill C-9’s potential to label economic critiques as “hate” (e.g., discussions on DEI—diversity, equity, and inclusion—policies or ESG—environmental, social, and governance—standards) could further deter foreign capital, as businesses seek jurisdictions with established and protected freedoms, like the U.S.
Third, free speech attracts talent and fosters a vibrant workforce, fueling growth. Skilled workers migrate to places where they can express themselves freely, contributing to brain gain. Countries like the U.S. and pre-restriction Canada have benefited from this; however, as Western speech freedoms wane, talent shifts elsewhere. A 2024 study by the Fraser Institute linked speech restrictions to slower GDP growth in OECD nations. In Canada, Bill C-9’s implications for religious and cultural expression could alienate diverse talent pools, exacerbating labor shortages and hindering sectors like healthcare and tech, ultimately constraining prosperity.
The Perils of Erosion and a Call to Action
The fading of free speech in the West, exemplified by Canada’s trajectory under Liberal governance, not only undermines democracy but also economic dynamism. Bill C-9, which was introduced in September 2025 and has advanced through committees, represents a tipping point: its removal of religious exemptions and expanded powers could lead to overreach, where subjective “hate” interpretations suppress legitimate debate. This fosters a culture of fear, reducing civic engagement and innovation, leading to societal stagnation and economic decline. To counter this, citizens must demand reforms—amending vague laws, strengthening judicial oversight, and prioritizing Charter protections. Free speech is not a luxury but the foundation of liberty and growth. Without it, democracies devolve into echo chambers, and economies into controlled mediocrity. Canada, once a beacon of freedom, must reclaim this principle to ensure a prosperous future for all.
B. Launched!
On November 13, we proudly launched our new Rocklinc Principled Equity Fund (TSX: RKLC). This actively managed value portfolio currently holds 17 equity positions. The vast majority of these holdings are unique, with minimal overlap compared to our flagship Rocklinc Partners Fund. The new fund is designed to provide clients with enhanced diversification, stronger capital protection, and lower overall volatility.
Here are the five reasons why we launched this new ETF.
1. Capitalize on the Growing Demand for Active ETFs in Canada
Canada leads globally in active ETF adoption, with about 30% of total ETF assets under management being actively managed, compared to just 8% in the US. Launching an active value ETF will allow Rocklinc to tap into this booming market, where investor demand and competition among providers are driving rapid growth. This will allow Rocklinc to increase our assets under management and reach a broader investor base. As our assets grow, we are able to invest more capital back into our business in order to provide higher quality investment services to our clients.
2. Showcase Expertise in Value Investing with High-Conviction Picks
Our value philosophy will focus on undervalued securities. A focused portfolio of 20 or fewer holdings enables Rocklinc to make concentrated, conviction-driven investments based on deep fundamental analysis. This structure will highlight our discretionary skills in active management, increasing the probability of above average returns and differentiating us from passive or broadly diversified funds.
3. Leverage ETF Structural Advantages for Efficiency and Appeal
ETFs offer benefits like intraday liquidity, tax efficiency, transparency, and lower costs compared to the average mutual fund. This makes them more attractive to both retail and institutional investors. For an active value strategy, this structure provides trading flexibility, allowing Rocklinc to efficiently implement and adjust a concentrated portfolio while appealing to investors seeking these features.
4. Potential for Outperformance in Volatile Markets
Value strategies in concentrated active ETFs can navigate market volatility by focusing on sustainable long-term returns and downside protection. In an environment where active management may outperform passive indexes, especially with a focused approach, Rocklinc can position the fund to capture upside return while managing risk, attracting investors looking for strong performance.
5. Competitive Edge Through Differentiation and Niche Targeting
With many ETFs being passive or diversified, a focused active value ETF stands out as a specialized product, offering a competitive advantage for Rocklinc. We can target niche investors interested in a high-conviction value fund in a crowded market.
C. North American Equity Market Statistics
Canadian Equities
In Q4 2025, the Canadian equity market, as measured by the S&P/TSX Total Return Index, rose 6.1%. Over the past year, the index gained 30.8%, including dividends. Our portfolio of Canadian companies, net of fees, increased 3.2% during the quarter and 44.8% over the past 12 months, outperforming the index by approximately 10% during 2025. Over the past five and ten years, our Canadian holdings achieved annualized returns of 10.6% and 13.3%, respectively. Compared to the S&P/TSX, we underperformed by 4.6% annually over five years but outperformed by 1.5% annually over ten years.
Our significant allocation to precious metals royalty companies was the primary driver of our outperformance. We remain confident in our core holdings and their strong long-term fundamentals. We remain focused on protecting capital and seizing opportunities that could arise very quickly. As we enter 2026, stock markets are at all-time highs and may be susceptible to a correction.
For the S&P/TSX Composite Index, 8 out of 11 GICS sectors delivered positive returns. Here is the sector breakdown ranked from highest to lowest quarterly returns:
- Materials: +11.9% (top performer, boosted by strong commodity prices, including gold and metals momentum into late 2025)
- Consumer Discretionary: +11.0%
- Financials: +10.5% (reflecting resilience in Canadian banks and insurers)
- Consumer Staples: +6.7%
- Information Technology: +2.8%
- Utilities: +1.9%
- Energy: +1.8%
- Health Care: +1.4%
- Industrials: -1.5%
- Communication Services: -1.7%
- Real Estate: -5.8% (weakest, possibly pressured by interest rate sensitivity or property sector headwinds)
During Q4 2025, cyclical and commodity-linked sectors lead the way (Materials and Consumer Discretionary), while more defensive or rate-sensitive areas like Real Estate lagged significantly. Financials also contributed meaningfully, aligning with broader strength in that area during 2025. Overall, the breadth of positive returns (8/11 sectors up) meant broad-based participation in the Q4 advance, though leadership was concentrated in just a few high-performing groups.
US Equities
In Q4 2025, our portfolio of U.S. and global companies, net of expenses, grew by 2.9%. Over the past 5 and 10 years, our portfolio achieved annualized returns of 10.0% and 12.9%, respectively. The companies we own offer strong fundamentals, above-average growth, and reasonable valuations. Over the past 5 years, our performance trailed the S&P 500 by 4.4%, and over 10 years, we underperformed it by 1.9%. However, we outperformed the Dow Jones Industrial Average (DJIA) by an annualized 2.2% and the Russell 2000, a small-cap index, by 4.8% over the same 10-year period.
Recent U.S. equity market performance has been increasingly concentrated in the hands of a relatively small number of highly valued companies. This remarkable run has been propelled by widespread investor enthusiasm for two powerful, long-term themes: the ongoing acceleration of digitization across industries and the explosive potential of artificial intelligence (AI). While we fully recognize that these secular trends represent genuinely transformative forces with the capacity to reshape economies, business models, and daily life over the coming decades, we continue to approach the current environment with the same discipline that has guided us through many market cycles.
We deliberately steer clear of overvalued securities trading at extreme multiples and resist the pull of purely speculative investments that promise outsized short-term rewards but often carry substantial downside risk. Our steadfast focus remains unchanged: to deliver consistent, risk-adjusted returns over the long term for our investors. We prioritize fundamental quality, reasonable valuations, and durable competitive advantages rather than chasing momentum or participating in the latest market frenzy. In many respects, we have seen this movie before. History has repeatedly shown that periods of intense concentration in a handful of richly priced “story” stocks—fueled by excitement about revolutionary new technologies—eventually give way to broader market participation and a return to more balanced valuations. We believe patience, prudence, and a long-term perspective remain the most reliable path to sustainable wealth creation.
Market Statistics
Pertinent market action during the Q4 of 2025 and during the last 12 months is captured in the following table.
| Dec. 31, 2024 | Sept. 30, 2025 | Dec, 31, 2025 | 3 Month Return | 1 Year Return | |
| CAD/USD | $0.6954 | $0.7185 | $0.7284 | +1.38% | +4.75% |
| Oil WTI (US $) | $71.72 | $62.37 | $57.42 | -7.94% | -19.9% |
| Gold (US $) | $2,624.50 | $3,840.80 | $4,318.00 | +12.4% | +64.5% |
| Silver (US $) | $28.90 | $46.20 | $71.54 | +54.85% | +147.5% |
| S&P/TSX | 24,728 | 30,107 | 31,713 | +5.33% | +28.24% |
| S&P 500 | 5,882 | 6,722 | 6,845 | +1.83% | +16.37% |
| Cdn 10 yr. | 3.22% | 3.18% | 3.43% | +25 bps | +21 bps |
| US 10 yr. | 4.57% | 4.15% | 4.17% | +2 bps | -40 bps |
The table provides a clear snapshot of key asset performance from the end of 2024 through Q4 2025, highlighting divergent trends across currencies, commodities, and equities.
Here’s a brief item-by-item commentary on the data (as of December 31, 2025, compared to prior periods):
CAD/USD
- Closed at $0.7284 (meaning 1 CAD buys ~0.7284 USD)
- Q4 gain: +1.38% (from $0.7185 at end-Q3)
- Full-year gain: +4.75% (from $0.6954 at end-2024)
The Canadian dollar strengthened steadily over the year and accelerated modestly in Q4. This reflects overall commodity support despite weakness in oil. It also reflects the very low valuation of the Canadian dollar at the beginning of 2025 when concerns over tariffs reached a high level.
Oil WTI (US$)
- Ended at $57.42 per barrel
- Q4 decline: -7.94% (from $62.37)
- Full-year decline: -19.9% (from $71.72)
Crude oil suffered significant pressure throughout 2025, with the downtrend steepening in the final quarter. This reflects ample global supply, softer demand growth, tied to global economic weakness and pressure from the Trump administration to keep the level of oil production as high as possible to help curb inflationary pressures.
Gold (US$)
- Settled at $4,318 per ounce (a massive new record high)
- Q4 surge: +12.4% (from $3,840.80)
- Full-year explosion: +64.5% (from $2,624.50)
Gold delivered one of its strongest annual performances in decades during 2025. The acceleration in Q4 underscores persistent safe-haven demand amid geopolitical tensions, central bank buying, inflation hedging, massive global debts and a favorable macro backdrop, namely lower real yields on fixed income securities.
Silver (US$)
- Finished at $71.54 per ounce
- Q4 rocket: +54.85% (from $46.20)
- Full-year colossal gain: +147.5% (from $28.90)
Silver far outpaced even gold, with explosive momentum in the final quarter. This reflects gold’s safe-haven spillover plus strong industrial demand (solar, electronics, EVs, AI-related), chronic supply deficits, and early cycle speculative fervour. Silver’s outsized leverage to both monetary and industrial themes made it the table’s top performer by a wide margin.
S&P/TSX
- Closed at 31,713
- Q4 advance: +5.33% (from 30,107)
- Full-year return: +28.24% (from 24,728)
The Canadian equity benchmark posted very strong gains, outperforming its U.S. counterpart over the full year which doesn’t happen too often. Q4 momentum was exceptional, supported by precious metals strength, mining/resource exposure, and some rotation into value/cyclical names despite oil’s weakness. Canadian Banks also performed exceptionally well in 2025 increasing by over 30% and representing approximately 30% of the index.
S&P 500
- Ended at 6,845
- Q4 gain: +1.83% (from 6,722)
- Full-year return: +16.37% (from 5,882)
U.S. large-caps delivered respectable double-digit returns in 2025, though gains moderated in Q4. This reflects a more mature bull market phase, with leadership broadening beyond mega-tech amid rotation and solid (but not spectacular) corporate earnings. This bodes well for many of our holdings that are trading at very attractive valuations and growing quickly, but have been overlooked by the enthusiasm of AI stocks and index (passive) investing.
CAD 10-year yield
- Ended at 3.43%
- Q4 rise: +25 bps
- Full-year rise: +21 bps (from 3.22%)
Canadian long-term yields ticked modestly higher over the year and rose in Q4, suggesting some re-pricing of growth/inflation expectations and reduced expectations for aggressive Bank of Canada easing is being priced in for 2026.
US 10-year yield
- Ended at 4.17%
- Q4 rise: +2 bps
- Full-year fall: – 40 bps
U.S. yields declined notably over 2025 overall (despite minor Q4 stability), reflecting Fed policy easing expectations and tamer inflation numbers in the U.S.
Overall takeaway
2025 was a year of dramatic divergence: precious metals (especially silver) staged historic rallies as hard assets and inflation hedges dominated, while energy lagged sharply. Equities performed well (with Canada outperforming the U.S.), the Canadian dollar firmed, and bond yields showed mixed but generally contained moves. The standout story remains the explosive bull market in gold and silver, which provided a powerful tailwind to resource-heavy Canadian indices amid broader global uncertainty.
D. ROCKLINC Investment Update
Private Client Assets – Separately Managed Accounts
Our ROCKLINC separately managed accounts delivered a 2.1% return in Q4 and a 19.6% return over the past year (ending December 31, 2025). More significantly, our average annual compound returns over the past 3, 5, and 10 years were approximately 13.3%, 7.5%, and 9.6%, respectively. These returns are net of fees and reflect an asset allocation of approximately 70% in equities, with the balance in short-term deposit accounts and short-term bonds. Please note that these figures represent aggregate performance across all accounts. Individual client portfolios may vary based on risk tolerance and specific asset allocations.
Our equity portfolio (comprising Canadian, U.S., and global equities) achieved an 3.2% return in Q4 and a 29.7% return over the past 12 months. Over the past 5 and 10 years, our equities have compounded at approximately 10.2% and 13.1% annually, respectively, aligning with major market indices. Our investment approach remains focused on the economic fundamentals of the businesses we own. We prioritize:
- Selectively adding companies identified through our research team’s analysis.
- Divesting underperforming businesses.
- Capitalizing on market volatility to increase positions at attractive prices.
With the launch of our new Rocklinc Principled Equity Fund ETF in November, we added a handful of new companies to our roster of businesses. Please see our brief writeup on our new ETF for a list of those new companies.
Rocklinc Partners Fund
Over the past four years, we have been utilizing the Partners Fund in more of the portfolios we manage. The Fund offers our clients a low cost and efficient way to purchase 18-20 strong businesses in one portfolio. It is an effective way to gain access to a global diversified portfolio with modest amounts of investment capital. Our number one objective is to create a Fund comprised of excellent companies that produce strong long-term performance.
Quarterly, we provide a performance update to our clients. Performance numbers are after all fees and rates of return beyond one year are annual compound rates of return.
Currently, the Fund is 9.8% in cash and short-term money market instruments (yielding 2.5 – 3%), 87.4% in publicly traded equities and 2.8% in two private equity investments. We expect our cash weighting to remain in the 8%-10% range given market valuations and investment opportunities. We finished the year with $52 million in total assets, up from $46 million at the beginning of the year. The total AUM of the Fund would have been larger but we repositioned approximately $15 million from our Partners Fund to our new ETF.
During Q4, there were a number of changes to the specific investments in the Fund. With the launching of our new ETF we moved some of the companies in the Partners Fund to our ETF allowing us to focus the portfolio and build larger positions in the Rocklinc Fund. We sold five companies during the quarter. The companies were SSC Security Services Corp (eliminated), Sandstorm Gold Royalities (bought by Royal Gold and moved to our ETF), Burford Capital Ltd, Danaher Corp., and Roper Technologies Inc., the latter three of which were moved to our ETF. Late in the quarter, we initiated a new positon in Power Metallic Mines.
After all expenses, the Rocklinc Partners Fund has been compounding at approximately 9.1% per year since inception (September 29, 2017) and by 15.5% and 7.7% over the past three and five years.
Over the past one and three years, the portfolio’s Canadian equities have compounded at 35.7% and 18.5%, while U.S. equities have compounded at 15% and 19.5%. Since inception in September 2017, Canadian equities have returned 12.6% annually, and U.S. equities have returned 12.4%. The Canadian holdings have consistently outperformed the S&P TSX since inception. The U.S. holdings have slightly underperformed the S&P 500 but have significantly outperformed the DJIA and Russell 2000.
Our top 12 holdings represent approximately 75.5% of the total portfolio and 84% of the equity weighting in the portfolio. The top 12 holdings are:
- Trisura Group Ltd. (10.5%)
- Markel Group Inc. (8.0%)
- Wheaton Precious Metals Corp. (7.8%)
- Brookfield Corp. (7.5%)
- Franco-Nevada Corp. (7.5%)
- Gold Royalty Corp. (6.6%)
- Amazon.com, Inc. (5.7%)
- Kelly Partners Group Holdings Ltd. (5.1%)
- Agnico Eagle Mines Ltd.(4.8%)
- Cameco Corp. (4.4%)
- APi Group Corp. (4.3%)
- Apple Inc. (3.3%)
As at December 31, 2025
| 3 mos. | 6 mos. | 1 yr. | 3 yr. | 5 yr. | Inception* | |
| RL Partners | 0.7% | 10.5% | 20.3% | 15.5% | 7.7% | 9.1% |
Rocklinc Kokomo Fund
In November 2022, we introduced the Rocklinc Kokomo Fund to offer our clients a regulated investment product registered outside Canada. The fund is domiciled in the Cayman Islands, a leading British Overseas Territory and the world’s premier offshore market for investment funds, with all assets securely held in custody in Grand Cayman.
The Rocklinc Kokomo Fund is supported by a robust team of professionals: FundBank serves as the Fund Custodian, SGGG Fund Services (Cayman) Inc. acts as the Fund Administrator, Carey Olsen provides legal counsel, and Grant Thornton (Cayman) is the Fund’s Auditor. The minimum investment is $100,000 USD, with the Net Asset Value (NAV) priced monthly, starting at $100.00 per unit. The portfolio is managed consistently with our discretionary accounts, comprising 15-20 stocks, low turnover, a competitive management fee, no performance fees, and monthly pricing and liquidity. Offering documents are available on our website or by contacting Rocklinc directly.
We began investing in the portfolio in February 2023 and continue to gradually build our core positions. As of December 31, 2025, the Fund’s total value was approximately $9.4 million USD, with units closing at $131.10 at the end of Q4. The Fund returned 20.8% in 2025 and has generated an annualized rate of return of 9.7% since inception. All returns are in USD. Consistent inflows have enabled us to increase existing positions, reduce underperforming holdings, and introduce new investments. Strong client interest continues, with new clients regularly joining the portfolio.
As of December 31, 2025, the portfolio consists of 19 equity positions, representing approximately 83% of its total asset value. The remaining 17% is held in a money market fund yielding about 4.1% annually. Our target is to maintain 15–20 equity positions, with overall equity exposure in the 85–90% range, depending on attractive buying opportunities and current valuations. We have been gradually increasing equity holdings while preserving a prudent level of cash reserves. During 2025, we added two new positions—Carlisle Companies Inc. and Kelly Partners Group Holdings Ltd.—and eliminated one position, MEG Energy Corp., following its acquisition by Cenovus Energy Inc.
The top 12 holdings by portfolio weighting are:
- Trisura Group Ltd.
- Wheaton Precious Metals Corp.
- Gold Royalty Corp.
- Brookfield Corp.
- OR Royalties Inc.
- Markel Corp.
- Amazon Inc.
- Kelly Partners Group Holdings Ltd.
- Brookfield Infrastructure
- Roper Technologies Inc.
- Franco-Nevada Corp.
- Altius Minerals Corp.
These positions represent approximately 64% of the total portfolio and 77% of the active equity weighting.
Rocklinc Principled Equity ETF (TSX: RKLC)
On November 13, 2025, we launched the Rocklinc Principled Equity Fund (TSX: RKLC), an actively managed value-oriented ETF. The fund currently holds 17 equity positions, the vast majority of which are unique and feature minimal overlap with our flagship Rocklinc Partners Fund. This new fund is designed to offer clients enhanced diversification, strong capital protection, and lower overall volatility. As of December 31, 2025:
- Assets under management stood at $33.94 million.
- The portfolio was allocated 29% to cash, with the remaining 71% invested across 17 equity positions.
The 17 equity holdings, listed by their approximate weighting in the portfolio as of December 31, 2025, are:
- Sprott Inc.
- OR Royalties Inc.
- Roper Technologies, Inc.
- ServiceNow Inc.
- Royal Gold Inc.
- Trisura Group Ltd.
- Agnico Eagle Mines Ltd.
- Burford Capital Ltd.
- Brookfield Infrastructure Partners L.P.
- Kinsale Capital Group, Inc.
- Cameco Corp.
- Carlisle Companies Inc.
- MercadoLibre Inc.
- Royalty Pharma plc
- Prologis Inc.
- Danaher Corp.
- American Coastal Insurance Corp.
For the most current details, including holdings, performance, and prospectus, please visit rocklinc.com or contact us directly.
E. Company Focus – Sprott Inc.
In the late 1990s, while the global financial markets were intoxicated by the dot-com bubble, Eric Sprott approached the market with a singular, skeptical question: “What survives a bear market?[1]” Recognizing that tech-heavy broader indices were dangerously overvalued, he pivoted toward precious metals—assets with a history of outperforming when paper wealth evaporates. Twenty-five years later, that foundational philosophy has evolved from a boutique contrarian bet into the gold standard in precious metals, making Sprott Inc. the definitive brand for real-asset investing[2].
Founded in 1981, Sprott is a leading global precious metals asset manager, providing more than 250,000 clients with access to investment strategies across precious metals and critical materials. Its platform spans the entire mining life cycle, from early-stage exploration and discovery, through development, to operation and production, allowing investors to gain diversified exposure across risk profiles and stages of capital formation.
A critical and often underappreciated advantage is the company’s renowned physical trust structure. Unlike standard commodity ETFs, Sprott’s physical trusts are fully backed by physical holdings, with each unit representing direct ownership in the underlying commodity. These trusts also offer physical redemption, allowing investors to receive the metal itself. This unique feature significantly enhances asset “stickiness” and closely aligns with investors’ intent to own scarce real assets. Custody is handled by highly trusted counterparties, most notably the Royal Canadian Mint, reinforcing confidence around asset integrity and security. For U.S. investors, these trusts also carry favorable tax treatment, as they are not classified as collectibles, enhancing after-tax returns relative to alternative structures.
During 2021, a period when gold ETFs globally experienced significant outflows, Sprott’s flagship Physical Gold Trust attracted over $300 million in net inflows, compared with approximately $10.8 billion of net outflows from the SPDR Gold Trust, managed by financial behemoth, State Street Global. A similar pattern emerged in silver, where Sprott captured $1.75 billion in net inflows while the largest competing silver ETF saw net outflows of roughly $424 million. Notably, in silver, Sprott’s share of net flows ran at roughly twice its share of AUM, with global market share increasing from ~10% to nearly 13% in a single month during early 2021. These figures speak to Sprott’s ability to not just capture investors’ desire for true physical exposure, but gain trust and market share, particularly during periods of market stress or heightened inflation concern.
In recent years, Sprott has successfully positioned itself at the center of the modern energy transition, most notably through its dominance in the uranium sector. The Sprott Physical Uranium Trust is now the largest holder of physical uranium in the world, with a market presence so significant that investors often remark “the Sprott market is the spot market.” By operating two specialized uranium ETFs and a physical trust that frequently sees more trading volume than the actual spot market, the firm has effectively become the institutional gateway for nuclear energy exposure, creating massive barriers to entry though scale and expertise that are very difficult to replicate.
The company’s growth trajectory remains aggressive, with Assets Under Management (AUM) currently around US$50 billion, up from approximately US$17 billion five years ago, reflecting strong organic inflows and favorable commodity performance. As scale increases, management fee-derived free cash flow should expand materially due to meaningful operating leverage, as largely fixed operating costs grow more slowly than AUM, enhancing profitability and increasing Sprott’s strategic value to larger global asset managers. This potential for a takeout provides a secondary layer of optionality for shareholders alongside the firm’s exemplary organic growth.
Beyond precious metals and uranium, Sprott is currently expanding into the broader natural resources sector, including rare earth metals and industrial metals. Their strategy follows the successful uranium blueprint: raise institutional capital with an appetite for physical exposure to acquire physical materials privately before launching them as public products. This allows investors to gain a diversity of exposure like a mutual fund, but with a critical difference in corporate structure—Sprott generates high-margin fees that support a robust dividend, essentially paying the investor to wait for the next commodity supercycle.
What compels us to be long-term investors in Sprott is its ability to provide leveraged exposure to rising commodity prices while avoiding the operational risks inherent in mining. By owning the manager rather than the miner, investors sidestep labour disruptions, geopolitical nationalization, and capital cost overruns that often erode returns across commodity cycles. This positions Sprott as a toll collector in the resource ecosystem, benefiting from higher metal prices through increased fee generation while maintaining the stability of a scaled and well-established financial brand.
As the largest holding in our Rocklinc Principled Equity ETF (RKLC) at the time of writing, Sprott remains a core position as the world increasingly recognizes the importance and indispensability of precious metals and critical materials. Alongside our holdings in the precious metal royalty peers, we believe Sprott represents one of the most attractive ways to participate in a sustained commodity upcycle over the long term.
F. Moving Forward
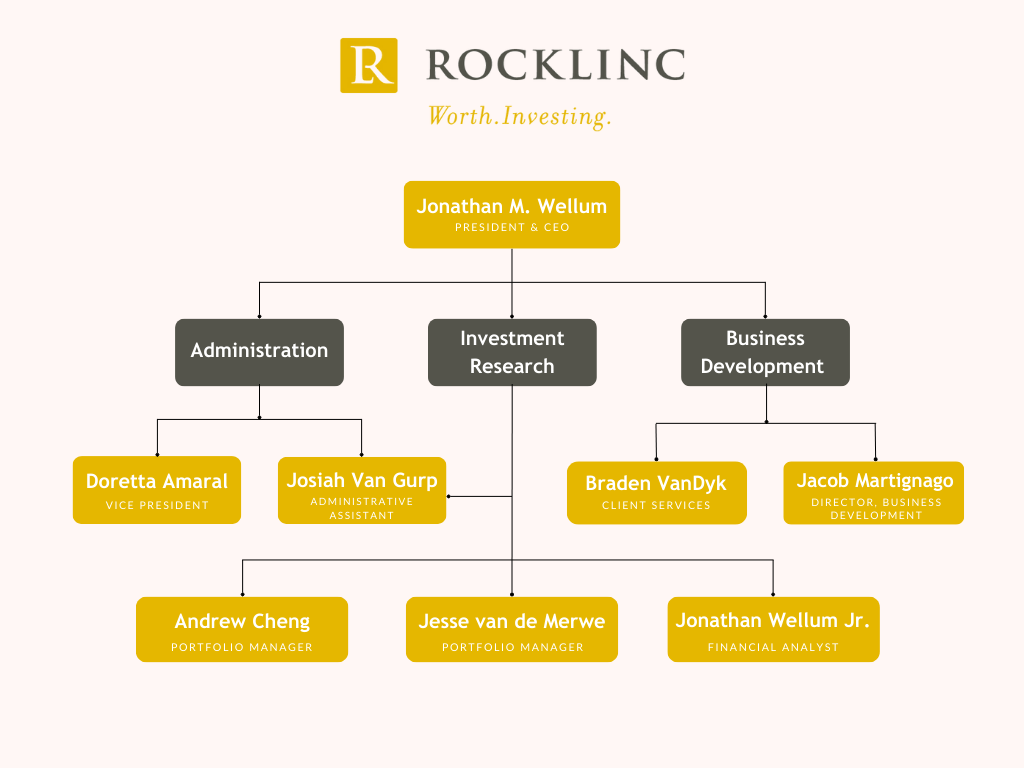
We continue to keep our eyes focused on the fundamentals of the businesses we invest in, within the context of a struggling global economy. We will do our best to take advantage of sharp moves in the market! We currently have eight full-time employees. Here is our organizational chart.
The investment team at Rocklinc is diligently managing our portfolio companies to meet or exceed expectations while seeking new opportunities to enhance your investments. Despite tariffs, trade tensions, or military activities, our core strategy remains unchanged: building portfolios of exceptional businesses. Below are ten key principles guiding our approach:
- Patience: We wait for attractively priced opportunities, leveraging our cash reserves to buy low during volatile periods. Tariff-related uncertainty may create short-term noise but also long-term opportunities. Quality companies at compelling valuations reward investors who focus on fundamentals, not headlines.
- Monitor Central Banks: Monetary policies, including repressed interest rates and increasing money supply, significantly influence market valuations. The policies being pursued by Central Banks are not supportive of strong currencies.
- Address Unsustainable Deficits: Government deficits pose risks to purchasing power. We maintain significant positions in precious metals and hard assets to mitigate these risks.
- Diversify Strategically: Our focused portfolios (25-30 securities) are diversified across asset classes, sectors, and regions to balance risk and opportunity.
- Prioritize Strong Balance Sheets: We invest in companies with tangible assets, robust financials, and minimal counterparty risk.
- Focus on Essential Industries: We target firms in growing sectors with long-term secular trends.
- Avoid High-Risk Firms: We minimize exposure to heavily leveraged financial companies with complex balance sheets, such as banks and insurers.
- Maintain Liquidity: Adequate cash reserves allow us to capitalize on market dislocations, earning 2.15% – 3.75% annually while preserving flexibility.
- Stay Opportunistic: We remain positive and proactive, grounded in realism and truth.
- Anchor in Faith: In a world desperately craving peace at every level, the prophet Isaiah opens the door to true and lasting peace: “You keep him in perfect peace whose mind is stayed on you, because he trusts in you. Trust in the LORD forever, for the LORD GOD is an everlasting rock.” (Isaiah 26:3–4, ESV)
For questions about your account, please contact us to schedule an appointment
ROCKLINC INVESTMENT PARTNERS INC.
Contact Information
ROCKLINC INVESTMENT PARTNERS INC.
4200 South Service Road, Suite 102
Burlington, Ontario
L7L 4X5
Tel: 905-631-LINC (5462)
www.rocklinc.com
| Doretta Amaral | damaral@rocklinc.com | (ext. 1) |
| Jonathan Wellum | jwellum@rocklinc.com | (ext. 2) |
| Jesse van de Merwe | jvandemerwe@rocklinc.com | (ext. 3) |
| Braden Van Dyk | bvandyk@rocklinc.com | (ext. 4) |
| Andrew Cheng | acheng@rocklinc.com | (ext. 5) |
| Jacob Martignago | jmartignago@rocklinc.com | (ext. 6) |
| Jonathan Wellum Jr. | jwellumjr@rocklinc.com | (ext. 7) |
| Josiah Van Gurp | jvangurp@rocklinc.com | (ext. 8) |
Disclaimer
The information contained herein reflects the opinions and projections of ROCKLINC (ROCKLINC) Investment Partners Inc. as of the date of publication, which are subject to change without notice at any time subsequent to the date of issue. ROCKLINC does not represent that any opinion or projection will be realized. All information provided is for informational purposes only and should not be deemed as investment advice or a recommendation to purchase or sell any specific security. While the information presented herein is believed to be reliable, no representation or warranty is made concerning the accuracy of any data presented. This communication is confidential and may not be reproduced without prior written permission from ROCKLINC.
[1] https://financialpost.com/commodities/mining/billionaire-eric-sprott-dishes-on-his-golden-investment-spree-its-like-being-at-a-table-with-a-winning-run
[2] https://golddiscovery.com/legacy/user/articles/view/eric-sprotts-mining-story