A. Faith and Economics: Why Rising Socialism Matters for Investors
“This is the shabby secret of the welfare statists’ tirades against gold. Deficit spending is simply a scheme for the confiscation of wealth. Gold stands in the way of this insidious process. It stands as a protector of property rights.”
– Alan Greenspan, 1967
Socialist and Marxist ideas are no longer confined to campus seminars. They are moving into party platforms, regulatory agencies, tax codes, monetary policy, and capital markets. The Democratic Socialists of America and aligned movements in Canada seen in our NDP Party and in parts of our Liberal party press for expansive state control over healthcare, housing, energy, education, and production, combined with aggressive redistribution and open suspicion of private property. For investors, this is not an abstract cultural debate. It is a regime-risk question. Collectivism changes incentives, weakens property rights, debases money, and redirects capital from productive enterprise to political allocation, eventually destroying the wealth of a nation.
True economics is never a neutral science. It begins with the Creator who owns and sustains the universe and who made humanity in His image. Without that foundation, societies drift toward the poverty, coercion, and concentrated power that have marked every sustained experiment in socialism where the State becomes god. As I have argued elsewhere, Christianity and Marxism are not two policy options on the same spectrum. They are rival religions. One begins with “In the beginning, God.” The other begins with “In the beginning, there was nothing,” and then enthrones the State as the final arbiter of law, conscience, and property. The West cannot survive without Christianity as its bedrock.
Economics Begins with God
“The earth is the Lord’s and the fullness thereof” (Ps. 24:1). That one sentence reshapes work, ownership, and wealth. Human beings are neither accidents nor raw material for planners. Made in God’s image (Gen. 1:26–27), they possess dignity, moral responsibility, and the capacity to create, plan, and steward. Immediately after creating man and woman, God issued the cultural mandate: be fruitful, fill the earth, subdue it, and exercise dominion (Gen. 1:28). Work was good before the Fall (Gen. 2:15). The Fall made labour harder, but it did not cancel the assignment. When starting with faith, productive work, buying, selling, hiring, investing and building is service to God, not mere survival.
Moral character is the ultimate scarce resource. Natural endowments do not save a people who have lost honesty, diligence, and the restraints that make contracts hold. The Democratic Republic of Congo holds vast cobalt, copper, gold, and diamonds, yet remains poor. Venezuela sits on enormous oil reserves, yet collapsed after the state looted production and destroyed trust. Easy extraction often finances theft and teaches a people that fortune is seized, not created. Ultimately, an economy is the visible fruit of a people’s inner life.
Marxism denies God and then must put something in His place. That something becomes the State. People cease to be image-bearers accountable to God and become members of a class or identity group. Labour ceases to be vocation and becomes struggle. Once people are mispriced and de-valued, capital is next.
Private Property: The Bedrock of Capital Formation
The Eighth Commandment, “You shall not steal,” and the Tenth, “You shall not covet,” only make sense if something can actually belong to someone. When God forbade theft, He affirmed personal ownership. Ownership of a limited portion of the universe is one way image-bearers imitate, in a creaturely way, God’s sovereignty over the whole.
Abraham bought a burial field and received a public deed (Gen. 23). Naboth refused to sell his vineyard to the king; Ahab’s seizure was judged as wickedness, not public good (1 Kings 21). The apostle Peter told Ananias that the land was his both before and after the sale (Acts 5:4). The sin was the lie, not the ownership of property. Paul the apostle, told the former thief to work with his hands so that he might have something to share (Eph. 4:28). Work produces property. Property makes generosity possible. Forced taking is not giving. It is theft.
Weak property rights weaken families. Weak families then lean on a larger State. Strong families with real assets keep government closer to its ordained role: punishing evil, praising good, and preserving peace so that people may live quiet and productive lives (Rom. 13:1–7; 1 Tim. 2:1–2).
This is not theory for portfolio managers. Secure title, predictable law, and the right to keep the fruit of one’s labour are the preconditions of long-term capital. Heavy redistribution lowers the reward for creating, innovating, and saving. Once production is made subservient to confiscation, there is less and less to confiscate. People do not eagerly produce what will be taken from them.
Markets, Incentives, and the Business of Stewardship
Microeconomics is simply the study of how households and firms allocate scarce resources through prices, incentives, and voluntary exchange. Inequality of outcome is expected in a world of different gifts and abilities (Matt. 25:14–30). Scripture commands justice, honesty, diligence, and generosity, not equality of results. The biblical safety net is voluntary and relational: family first, then the household of faith, then private charity (1 Tim. 5:3–16; Gal. 6:10). When the State becomes first provider, families, churches and other charitable organizations are displaced, and dependence on the State grows where responsibility should have grown.
Markets coordinate knowledge no central planner can possess. Prices signal scarcity. Profit, in an honest exchange, is evidence that someone else’s problem has been solved and that more capital has been created for reinvestment. History and experience has shown that ownership, employment, profit, competition, and lending are morally good in themselves when conducted rightly. There is no sacred-secular divide that relegates marketplace activity to second-class status.
Theologian and stateman, Abraham Kuyper reinforced this point when he talked about sphere sovereignty. Family, church, business, education, and the state each receive authority from God, not from the state. When government becomes an “octopus” that owns production, dictates capital allocation, or imposes ideological mandates through ESG and DEI frameworks, it violates the created order. Capital allocation itself is a moral act. Deciding where capital goes is stewardship, not a merely technical exercise. Profit sought as value created for others is wonderful. Profit extracted by political favour is something else.
History is not ambiguous. Relatively secure property and limited interference lifted living standards in nineteenth-century Britain and America. Post-war Hong Kong and West Germany after 1948 showed what released private initiative can do. Collectivist experiments have produced shortages, capital flight, environmental ruin, and mass death. Soft “democratic” variants inherit the same logic: expand the State’s claim on the economic sphere until incentives and liberty erode.
Macroeconomics: The State, Money, and National Policy Risk
Civil government is not authorized to set wages across an economy, centrally plan production, or become the permanent provider of welfare, education, and healthcare. F. A. Hayek’s warning in The Road to Serfdom remains useful: central planning requires control over the means for all human ends. Because knowledge is dispersed, planning requires arbitrary power. Each intervention creates problems that seem to demand the next, until freedom is lost.
Western governments have grown far beyond the modest public sectors of the early postwar decades at approximately 20% of GDP. Across the OECD, general government expenditure has recently averaged over 40 percent of GDP, and in parts of Europe much higher, reaching levels of 55-60% of GDP. Large public sectors crowd out the private sector where wealth is actually created. Progressive taxes, capital-gains taxes, inheritance taxes, and expansive property taxes function as ongoing claims on private capital.
Sound money is a moral issue. The Bible demands honest weights and measures (Lev. 19:35–36; Prov. 11:1). Fiat systems that permit unlimited money creation function as a slow, hidden tax. Since the final break with gold convertibility in 1971, the US dollar has lost the vast majority of its purchasing power. After 2008, and again after COVID, balance-sheet expansion, monetized debt, suppressed rates, and transferred wealth toward debtors and those closest to newly created money. Households with few assets watched wages lag and asset prices move beyond reach. Global debt has risen to roughly 350 percent of GDP. A biblical approach favors money substantially constrained by something governments cannot create at will, such as gold.
R. J. Rushdoony’s Politics of Guilt and Pity explains the moral psychology behind the expansion of the State. Modern politics cultivates guilt for prosperity and then offers the State as the instrument of atonement through redistribution. Pity is weaponized to create dependence. That same pattern appears in what I have called the West’s “suicidal empathy”: envy rebranded as compassion, producers treated as the problem, and confiscation treated as justice. For investors, the result is familiar: thinner growth, higher policy risk, capital flight, and a preference for real assets that resist debasement.
Nation-states that preserve competitive markets, limited government, and the rule of law serve flourishing better than centralized globalist structures. Comparative advantage and voluntary trade create mutual benefit. Industrial policy and aggressive redistribution typically produce the capital flight and declining productivity they claim to cure.
No Synthesis with Marxism
The contemporary left recycles core Marxist commitments under democratic language: skepticism of private property, collective control of major economic levers, equality of outcome, and analysis of society through oppression hierarchies. Cultural Marxism extends the conflict framework into family, gender, race, and culture. No synthesis is possible. Western thought, influenced by the Bible, accepts differences in gifting as providence and commands voluntary generosity. Marxism destroys incentives and fosters resentment. Under Marxism, the State becomes Leviathan, the opposite of limited government.
A word of caution is needed. The Bible is severe toward the rich who crush the poor or make gold their god. It is equally severe toward sloth, theft, and coveting. Christian economics is not a blank cheque for every corporation or every inequality. It is support for ownership, honest exchange, limited civil power, and generosity that is free and from the heart.
Implications for Investors and Stewards
The practical conclusions are concrete. Work as unto the Lord. Live below your means. Save and invest with a long horizon. Avoid excessive consumer debt. Provide first for your household. Give generously. Seek to leave an inheritance (Prov. 13:22). Allocate capital toward enterprises that create real value rather than toward ideologies that pathologize merit. Prefer jurisdictions and businesses that still honour property, contracts, and honest accounting. Hold some real assets as a hedge against monetary debasement. Resist the normalcy bias that treats expanding state claims as inevitable.
Parents, business owners, and capital allocators bear special responsibility. Children trained in guilt and envy will be vulnerable to collectivist appeals. Those trained in stewardship and the goodness of productive work will be harder to recruit. Families and faith-based organizations should not outsource economic instruction to institutions already catechizing the next generation in resentment.
The path to flourishing is not expanded state control or egalitarian leveling. It is the recovery of biblical foundations: God’s sovereignty and rule above the State, the cultural mandate, protected private property, free markets under moral law, honest money, limited government, strong families, and voluntary generosity. These principles underwrote much of the prosperity and liberty of the West. Their abandonment explains much of the present debt, inflation, capital flight, and cultural decay.
B. North American Equity Market Statistics
Canadian Equities
In Q3 2026, the Canadian equity market, as measured by the S&P/TSX Total Return Index, rose 1.48%. Over the past year, the index gained 19.35%, including dividends. Our portfolio of Canadian companies, net of fees, increased 2.02% during the quarter and was up by 11.23% over the past 12 months. The Canadian market was heavily influenced by two large sectors, banks and energy which we remain underweight. We are pleased with our positions and look forward to the remainder of the year. Precious metals, which continue to be very volatile are well positioned to resume their upward trek and Canadian Banks and Energy stocks are trading at high valuations. Over the past five and ten years, our Canadian holdings achieved annualized returns of 12.40% and 11.90%, respectively. Compared to the S&P/TSX, we underperformed by 1.9% annually over five years but outperformed by .3% annually over ten years.
We remain highly confident in our core holdings and their durable long-term fundamentals, including strong balance sheets, proven management teams, and embedded growth options. As active managers, we stay disciplined in our approach: prioritizing capital preservation while remaining alert to attractive opportunities that can emerge rapidly during periods of market dislocation. As we move into Q4 2026, with stock markets hovering near all-time highs, we are mindful that valuations appear stretched and the environment may be vulnerable to a meaningful correction. Our companies are trading at much better prices and valuations than the overall market.
For the S&P/TSX Composite Index, 3 out of 11 GICS sectors delivered positive returns during Q3 2026. The index itself rose 1.6%. Here is the sector breakdown ranked from highest to lowest quarterly returns (total return, as of September 30, 2026).
Information Technology (+17.9%)
Information Technology led all groups in Q3 2026 with a strong +17.9% return. The advance was the largest sector gain of the quarter and the main positive offset to weakness elsewhere in the index.
Materials (+12.9%)
Materials posted the second-best return at +12.9%, comfortably outperforming the broader index. Strength in precious-metals names was a key support after the sector had been among the weakest groups in Q2.
Energy (+3.3%)
Energy rose +3.3%, ranking third and finishing as the only other sector in positive territory. The gain reversed the sector’s decline in the prior quarter.
Financials (-3.0%)
Financials declined -3.0%. Despite its heavy index weight, the sector was a drag on the overall market after leading returns in Q2.
Industrials (-3.2%)
Industrials fell -3.2%. The result reversed the solid gain the sector posted in the second quarter.
Consumer Discretionary (-5.1%)
Consumer Discretionary lost -5.1% during the quarter, underperforming the broader index.
Health Care (-5.4%)
Health Care declined -5.4%, a sharp reversal from its second-place finish in Q2.
Consumer Staples (-7.0%)
Consumer Staples recorded a -7.0% return, lagging in a mixed market environment.
Utilities (-7.2%)
Utilities posted a -7.2% return, giving back the modest gain seen in the prior quarter.
Real Estate (-7.3%)
Real Estate fell -7.3%. Higher bond yields weighed on the rate-sensitive group.
Communication Services (-9.3%)
Communication Services finished as the weakest sector, declining -9.3%. The drop was the largest sector decline of the quarter and weighed on overall index results.
US Equities
In the third quarter of 2026, our portfolio of U.S. and global companies increased by 6.90% net of expenses. This performance occurred against a strong market backdrop, as major U.S. indices also posted robust positive returns amid a broadening rally. The S&P 500 rose approximately 17.8%, while the Dow Jones Industrial Average gained roughly 9.72%. Several factors contributed to the broader market advance, including strong corporate earnings growth (exceeding 20% year-over-year for the S&P 500), renewed enthusiasm for AI and technology investments, especially semiconductor stocks, broadening participation across market sectors with notable strength in small-cap and value stocks, and resilient underlying economic fundamentals. Growth-oriented sectors led the rally, while value-oriented and certain defensive areas participated more modestly.
Our portfolio continues to deliver attractive results over longer horizons:
- 5-year annualized return: 9.4%
- 10-year annualized return: 12.4%
These results underscore the long-term compounding power of owning high-quality businesses with strong fundamentals, above-average earnings growth potential, and reasonable valuations, the core of our investment philosophy. Over the past five years, our portfolio underperformed the S&P 500 by approximately 4.4% annualized. Over the 10-year period, that underperformance narrowed to 2.9% annualized. At the same time, we outperformed both the Dow Jones Industrial Average and the Russell 2000 Value by 1.6% and 5.3% annualized over the full 10-year span.
This pattern is consistent with our approach: we select individual companies based on their own merits rather than trying to match the composition of any index. The S&P 500’s recent outperformance has been driven by a narrow group of large-cap growth stocks. As these leaders face increasing headwinds, focused value portfolios are typically well positioned to outperform broader market indices.
Our holdings are chosen for their ability to compound intrinsic value over time, not to track market-cap-weighted benchmarks. We have navigated similar environments before, most notably during the technology and internet bubble of 1998–2000 and remain focused on protecting investor capital.
For the S&P 500 Composite Index, 4 out of 11 GICS sectors delivered positive returns during Q3 2026 (through September 30). Leadership reversed sharply from Q2: Energy, which performed last in the prior quarter, finished first, while rate-sensitive sectors lagged as the 10-year Treasury yield moved above 5% and the Fed raised rates for the first time since 2023. Here is the sector breakdown ranked from highest to lowest quarterly returns:
Energy (+16.5%)
The sector was the clear leader, reversing a sharp Q2 decline as renewed fighting between the U.S. and Iran pushed crude back above $100 a barrel and diesel prices hit an all-time high in mid-September. Stronger refining margins lifted producers and refiners; Marathon Petroleum, Phillips 66, and Valero each rose roughly 50% in the quarter.
Health Care (+6.6%)
Health Care finished a distant second, with steady gains from pharmaceutical and biotech names and a more defensive profile as economically sensitive sectors struggled. Innovation and demographic demand remained supportive even as higher yields weighed on broader equities.
Communication Services (+3.9%)
The sector posted a modest gain, helped by digital advertising and AI-related monetization at mega-cap platforms. Strength in names such as Alphabet and Meta offset weaker traditional telecom and cable results.
Information Technology (+2.9%)
Technology advanced, but the pace slowed sharply after an extraordinary Q2 rally. AI infrastructure demand, semiconductors, and data-center spending remained the central theme; within the sector, software rebounded and outperformed semiconductors, which pulled back after their second-quarter surge. The sector’s size still meant its smaller gain had an outsized effect on the index.
Financials (0.0%)
Financials were essentially flat. Higher rates offered some support to net interest margins, but rising yields, softer loan and housing activity, and a more cautious macro backdrop limited upside for banks and capital markets firms.
Consumer Staples (-2.3%)
Consumer Staples declined as defensive demand was not enough to offset higher energy costs, reaccelerating inflation, and a shift away from lower-beta sectors. Essential-goods companies provided some resilience but lagged the modest market gain.
Materials (-3.8%)
Materials fell as higher financing costs and uneven industrial activity outweighed any residual support from infrastructure and commodity demand. The sector lacked the commodity-price tailwind that lifted Energy.
Real Estate (-6.3%)
Real Estate declined as the 10-year yield above 5% and mortgage rates back above 7% pressured property values, refinancing, and demand for income-oriented assets. Data-center REITs tied to AI power demand were a partial offset to weakness in more traditional property types.
Consumer Discretionary (-7.0%)
The sector fell as higher energy costs and tighter financial conditions weighed on household spending. Strength in selected digital and platform names was not enough to offset pressure in traditional retail, autos, and other cyclical consumer areas.
Industrials (-9.6%)
Industrials reversed sharply after solid Q2 gains. Longer-term themes—infrastructure, defense, reshoring, and the physical buildout around AI data centers—remained intact, but higher financing costs and a reset in expectations overwhelmed those supports during the quarter.
Utilities (-12.4%)
Utilities were the worst-performing sector, their weakest quarter since Q1 2020. Growing power demand from AI data centers did not offset the hit from higher interest rates: heavy borrowing needs raised financing costs, and rising Treasury yields made utility dividends less attractive.
Market Statistics
Pertinent market action during Q3 2026 and during the last 12 months is captured in the following table.
| Sept. 30, 2025 | June 30, 2026 | Sept. 30, 2026 | 3 Month Return | 1 Year Return | |
| CAD/USD | $0.7185 | $0.7048 | $0.7024 | -0.34% | -2.24% |
| Oil WTI (US $) | $62.37 | $70.08 | $90.61 | +29.29% | +45.28% |
| Gold (US $) | $3,841 | $4,014 | $4,155 | +3.51% | +8.18% |
| Silver (US $) | $46.20 | $58.99 | $60.35 | +2.30% | +30.63% |
| S&P/TSX | 30,107 | 34,857 | 35,259 | +1.15% | +17.11% |
| S&P 500 | 6,722 | 7,499 | 7,652 | +2.04% | +13.84% |
| Cdn 10 yr. | 3.18% | 3.38% | 3.99% | +61 bps | +81 bps |
| US 10 yr. | 4.15% | 4.45% | 5.30% | +85 bps | +115 bps |
The table provides a clear snapshot of key asset performance from the end of Q3 2025 through Q3 2026, highlighting divergent trends across currencies, commodities, and equities.
The following breakdown provides context for each financial metric as of September 30, 2026, highlighting the specific drivers behind the quarterly and annual returns.
Currencies & Interest Rates
• CAD/USD ($0.703): The Canadian dollar weakened modestly this quarter. A widening yield gap in favour of the US dollar, driven by stronger US growth and a hawkish shift in Federal Reserve expectations, outweighed support from higher oil prices. Canada’s ongoing regulatory and taxation burdens on the energy sector continued to limit investment and structural support for the currency.
• CAD 10 yr. (3.99%): Canadian yields rose 61 bps this quarter. Renewed energy-driven inflationary pressures and reduced expectations for Bank of Canada easing amid resilient growth pushed yields higher, even as domestic regulatory headwinds persisted.
• US 10 yr. (5.30%): US yields rose 85 bps this quarter. Stronger US economic data, resilient growth, and a shift away from safe-haven demand (as geopolitical risks around energy re-escalated) pushed Treasury yields higher, with the Fed delivering a rate hike in September.
Commodities
• Oil WTI ($90.61): Oil was the quarter’s biggest gainer, rising approximately 29%. The surge reflected the rebuilding of a geopolitical risk premium as tensions involving Iran and the Strait of Hormuz re-escalated, reversing the sharp de-escalation and supply-easing narrative that had driven the Q2 collapse.
• Gold ($4,155): Gold rose approximately 3.5% this quarter, posting a modest rebound after its prior correction. Renewed geopolitical tensions and higher oil prices supported safe-haven demand, though rising real yields and a firmer US dollar limited upside. Central bank buying and long-term diversification demand continued to provide a strong floor under its price. The future remains very bright for gold prices given the massive and growing indebtedness of the global economy.
• Silver ($60.34): Silver rose roughly 2.3% this quarter. The metal recovered some ground as industrial demand concerns eased alongside higher energy prices and renewed risk sentiment in parts of the market, despite elevated yields. We view this as a continued opportunity to build exposure to this critical precious metal amid the ongoing structural deficit.
Equity Markets
• S&P/TSX (35,259): The Canadian benchmark gained 1.15% this quarter. It benefited from the resource tilt and higher oil prices, though weakness in materials and a late-quarter pullback limited upside. Energy provided support, while the banks were mixed amid higher yields.
• S&P 500 (7,652): The S&P 500 advanced approximately 2.0% this quarter. Gains were more moderate than in Q2, fueled by solid corporate earnings and energy-sector leadership, though rising bond yields and a rotation away from narrow AI/tech leadership capped the upside. Mega-cap tech recovered modestly after earlier volatility.
Overall takeaway
Q3 2026 delivered a sharp reversal from Q2’s commodity-driven moves. The re-escalation of Middle East geopolitical risks (particularly around Iran and energy flows) triggered a strong rebound in oil prices, which in turn revived inflation concerns and pushed bond yields sharply higher. This environment produced only modest equity gains (with energy leading), a weaker Canadian dollar, and a partial recovery in gold and silver. Canadian markets posted small gains but underperformed the S&P 500 as the commodity complex rebounded unevenly. The quarter highlighted how quickly markets can reprice geopolitical and inflation risks!
C. ROCKLINC Investment Update
Private Client Assets – Separately Managed Accounts
Our ROCKLINC separately managed accounts delivered a 3.30% return in Q3 and a 7.00% return over the past year (ending September 30, 2026). More significantly, our average annual compound returns over the past 3, 5, and 10 years were approximately 14.33%, 8.00%, and 8.6%, respectively. These returns are net of fees and reflect an asset allocation of approximately 70% in equities, with the balance in short-term deposit accounts and short-term bonds. Please note that these figures represent aggregate performance across all accounts. Individual client portfolios will vary based on risk tolerance and specific asset allocations.
Our equity portfolio (comprising Canadian, U.S., and global equities) achieved a 3.51% return in Q3 and a 10.22% return over the past 12 months. Over the past 5 and 10 years, our equities have compounded at approximately 11.03% and 12.0% annually, respectively, aligning with major market indices. Our investment approach remains focused on the economic fundamentals of the businesses we own. We prioritize:
- Selectively adding companies identified through our research team’s analysis.
- Divesting underperforming businesses.
- Capitalizing on market volatility to increase positions at attractive prices.
Rocklinc Partners Fund
Over the past four years, we have been utilizing the Partners Fund in more of the portfolios we manage. The Fund offers our clients a low cost and efficient way to purchase 16-20 strong businesses in one portfolio. It is an effective way to gain access to a global diversified portfolio with modest amounts of investment capital. Our number one objective is to create a Fund comprised of excellent companies that produce strong long-term performance.
Quarterly, we provide a performance update to our clients. Performance numbers are after all fees and rates of return beyond one year are annual compound rates of return.
Currently, the Fund is 14.0% in cash and short-term money market instruments, including 3 short-term corporate bonds (yielding 3 – 3.5%), 83.4% in publicly traded equities and 2.6% in two private equity investments. We expect our cash and bond weightings to remain in the 10%-20% range given market valuations and investment opportunities. We finished the quarter with $54.5 million in total assets.
During Q3, there were no significant changes to the holdings in the Fund. All of our equity investments in the portfolio are performing as expected, in terms of the actual businesses, and are trading at attractive prices.
After all expenses, the Rocklinc Partners Fund has been compounding at approximately 8.4% per year since inception (September 29, 2017) and by 14.00% and 7.90% over the past three and five years. Over the past three and five years, the portfolio’s Canadian equities have compounded at 18.87% and 10.66%, while U.S. equities have compounded at 15.34% and 7.61%. Since inception in September 2017, Canadian equities have returned 11.68% annually, and U.S. equities have returned 11.14%.
Our top 12 holdings represent approximately 72.17% of the total portfolio and 86.6% of the equity weighting in the portfolio. The top 12 holdings are Trisura Group (9.58%), Wheaton Precious Metals Corp. (8.37%), Franco-Nevada Corp. (8.08%), Markel Group (6.53), Amazon.com Inc. (6.25%), Brookfield Corp. (5.81%), Agnico-Eagle Mines Ltd (5.07%), Apple Corp. (4.78%), Gold Royalty Corp. (4.78%), Cameco Corp (4.53%), Altius Minerals (4.21%) and API Group Corp. (4.23%).
Precious metals constitute our largest sector allocation at 28.9% of the portfolio. This concentration is expected to produce elevated volatility on a quarter-to-quarter basis, yet we believe the sector is well positioned to rank among the strongest performers over the next three to five years. The thesis is underpinned by elevated global debt levels and the structural pressure on governments and central banks to continue debasing fiat currencies through monetary expansion.
Virtually all of our precious metals exposure, with the exception of Agnico-Eagle, is held in royalty companies. This structure provides leveraged upside to rising metal prices while limiting operational, capital, and jurisdictional risks relative to pure-play miners.
We maintain an additional allocation of approximately 10.6% in base metals, uranium, and agricultural materials. Holdings in this sleeve include Altius Minerals, Cameco, and Power Metallic Mines. Each company is positioned to create substantial shareholder value over the coming months and years, supported by favorable supply-demand dynamics in their respective commodities and management teams with demonstrated records of disciplined capital allocation.
As of Sept. 30, 2026
| 3 mos. | 6 mos. | 1 yr. | 3 yr. | 5 yr. | Inception | |
| RL Partners** | 1.64% | 0.12% | 1.15% | 14.00% | 7.90% | 8.35% |
** Inception September 29, 2017 (NBN1212)
Rocklinc Kokomo Fund
In November 2022, we introduced the Rocklinc Kokomo Fund to offer our clients a regulated investment product registered outside Canada. The fund is domiciled in the Cayman Islands, a leading British Overseas Territory and the world’s premier offshore market for investment funds, with all assets securely held in custody in Grand Cayman.
The Rocklinc Kokomo Fund is supported by a robust team of professionals: FundBank serves as the Fund Custodian, SGGG Fund Services (Cayman) Inc. acts as the Fund Administrator, Carey Olsen provides legal counsel, and Grant Thornton (Cayman) is the Fund’s Auditor. The minimum investment is $100,000 USD, with the Net Asset Value (NAV) priced monthly, starting at $100.00 per unit. The portfolio is managed consistently with our discretionary accounts, comprising 15-20 stocks, low turnover, a competitive management fee, no performance fees, and monthly pricing and liquidity. Offering documents are available on our website or by contacting Rocklinc directly.
We began building the portfolio in February 2023 and have continued to gradually add to our core positions.
As of September 30, 2026, the Fund’s total value stood at approximately $9.3 million USD, with units valued at USD $121.96 at quarter-end. The Fund delivered a strong return of 20.8% for the full year 2025 and reached a new all-time high of USD $140.17 on February 28, 2026. Heightened geopolitical tensions from the war in Iran, combined with a sharp pullback in precious metals, have weighed on the overall valuation. We continue to see substantial upside in the existing portfolio given the quality and value of the companies we own.
As of September 30, 2026, the portfolio consists of 19 equity positions, representing approximately 84% of total assets. The remaining 16% is held in a money market fund yielding about 4.1% annually. Our target is to maintain 15–20 equity positions, with overall equity exposure in the 85–95% range depending on attractive opportunities and valuations. We have been gradually increasing equity holdings while preserving a prudent cash reserve. During Q3, we made no significant changes to the portfolio.
The top 12 holdings by portfolio weighting are:
- Wheaton Precious Metals Corp.
- Trisura Group Ltd.
- Altius Minerals
- Brookfield Corporation
- Gold Royalty Corp.
- OR Royalties Inc.
- Franco-Nevada Corp.
- Kelly Partners Group Holding
- Amazon Inc.
- Royalty Pharma plc
- Markel Corp.
- Carlisle Co.
These positions represent approximately 64% of the total portfolio and 76% of the active equity weighting.
Rocklinc Principled Equity Fund ETF (TSX: RKLC)
On November 13, 2025, we launched the Rocklinc Principled Equity Fund (TSX: RKLC), an actively managed value-oriented ETF. The fund currently holds 17 equity positions, the vast majority of which are unique and feature minimal overlap with our flagship Rocklinc Partners Fund. This new fund is designed to offer clients enhanced diversification, strong capital protection, and lower overall volatility. As of September 30, 2026:
- Assets under management stood at $44.2 million up from $40.7 at the end of Q2.
- The portfolio was allocated 18.6% to cash, which earned approximately 3.25%, with the remaining 81.4% invested across 17 equity positions. There were no significant changes to the portfolio during the Q3. All the businesses are performing very well and trading at attractive valuations.
The following commentary reviews our major holdings by sector exposure.
The Royalty and Gold Mining Segment
Sprott Inc., Agnico Eagle Mines, OR Royalties, and Royal Gold demonstrated resilience through continued volatility in gold prices during the third quarter. Gold entered Q3 near the $4,000–$4,050/oz area following the sharp Q2 correction (which had closed near $4,008/oz), rebounded notably through August with periods of strength above $4,400–$4,500/oz, then softened in September amid firmer U.S. dollar and yield dynamics, inflation concerns, and tighter policy expectations. The metal averaged roughly $4,270/oz for the quarter and closed September 30 near $4,155/oz. Our view is that gold is going much higher over the next 3-5 years given the global debt crisis and the need to debase the world’s fiat currencies.
This environment supported solid results for high-quality royalty and streaming businesses while creating mixed pressure on more price-sensitive exposure. OR Royalties (formerly Osisko Gold Royalties) delivered strong preliminary Q3 results with 20,237 attributable gold equivalent ounces (GEOs), approximately $90.2 million in royalty and stream revenues, and an exceptional ~96.8% cash margin. The company continued capital returns via share buybacks and completed selective royalty acquisitions while maintaining a robust cash position and elevated margins relative to historical levels.
Agnico Eagle maintained operational progress and production tracking, though full-year 2026 guidance trended toward the lower end of its 3.3–3.5 million ounce range following a rock mass movement at the Barnat open pit within the Canadian Malartic Complex early in the quarter. Strong margins were supported by still-elevated gold prices versus historical averages, with a solid balance sheet and cash generation remaining key strengths (Q3 results were scheduled for late October).
Royalty-focused names performed more steadily overall. Royal Gold continued to benefit from its expanded portfolio (including prior Sandstorm/Horizon and other transactions), higher realized metals prices in prior periods, and diversified cash flows, positioning it for solid ongoing results. Sprott faced residual AUM pressure from earlier market value declines in physical trusts and related products (Q2 AUM stood at $55.6 billion after a sharp drop from Q1 peaks), but structural demand for precious metals and critical materials exposure remained intact amid the Q3 recovery in gold prices (Q3 results pending in early November).
Infrastructure, Insurance, and Industrial Holdings
Brookfield Infrastructure, Trisura Group, Kinsale Capital, American Coastal Insurance, Carlisle Companies, Roper Technologies, Prologis, and Rolls-Royce Holdings remained resilient overall. These businesses continued to benefit from their defensive characteristics, contractual or pricing-power-driven revenue streams, and quality balance sheets. Specialty insurers (e.g., Kinsale, Trisura) operated in a favorable pricing and disciplined underwriting environment. Quality compounders such as Roper Technologies and Prologis continued to trade at valuations offering attractive long-term margins of safety, despite broader market volatility and mixed sentiment. Brookfield Infrastructure maintains a track record of stable, inflation-linked or utilization-driven cash flows. Prologis and several others were approaching Q3 reporting windows in mid-to-late October, with expectations centered on steady operational execution.
Technology and Growth-Oriented Names
ServiceNow, MercadoLibre, Cameco, Burford Capital, and Royalty Pharma continued to show varied stock performance despite excellent financial results. ServiceNow faced ongoing valuation pressure related to AI-related concerns and growth expectations, though its durable competitive advantages and platform strength remain strong at current levels. We believe that the company has tremendous upside and the market is pricing the business incorrectly. Cameco benefited from secular tailwinds in the energy transition and uranium demand (Q3 results scheduled for late October). Burford Capital continued to demonstrate leadership in complex litigation finance, offering significant upside potential tied to its unique business model, albeit with the inherent volatility of case outcomes and realizations (Q3 reporting expected in early November). Royalty Pharma continued to demonstrate resilient cash flows from its diversified biopharma royalty portfolio; the stock remained attractively valued relative to its stable, high-quality cash flow profile. (See our detailed write-up on this company later in this report).
Overall, the portfolio’s emphasis on high-quality businesses purchased with a margin of safety, particularly those with royalty-like or predictable economics, strong balance sheets, and pricing power, helped it navigate a volatile quarter marked by gold price fluctuations and shifting market sentiment. We remain focused on intrinsic value, patient capital allocation, and avoiding overvalued speculative areas. No changes to our core conviction holdings as we enter the fourth quarter. We continue to prioritize long-term compounding through disciplined value investing. For the most current details, including holdings, performance, and prospectus, please visit rocklinc.com or contact us directly.
D. Company Focus – Royalty Pharma plc
The Toll Collector of Medical Innovation
For decades, bringing new medicine to the benefit of the masses has followed a punishing trajectory. In the quiet, microscopic worlds of academic labs and fledging biotech firms, new compounds are screened, analyzed and tested to produce a viable contender for preclinical testing. Then commences the clinical marathon of Phase I, II and III trial testing, typically at the cost of several hundred million dollars. This multi-year, capital-incinerating odyssey is where billions of dollars of value are created or destroyed in the high-stakes world of binary clinical outcomes.
In 1996, an analyst named Pablo Legorreta at the American investment bank Lazard, looked at this landscape and saw a structural market failure. Laboratories were discovering miracle molecules, universities were hatching life-saving science, and cash-strapped biotech minnows were suffocating for capital, yet the financial markets treated medical innovation purely as an all-or-nothing equity gamble. Legorreta stepped away from traditional banking to build an entirely new kind of financial architecture. He envisioned a firm that would not invent drugs, nor take on the clinical heartbreak of Phase II trials. Instead, it would act as a specialized financial intermediary—a buyer of the rights to future revenues of breakthrough medicines.
For its first decade, Royalty Pharma’s greatest challenge was evangelization. Academics, major pharmaceutical giants, and research institutions looked at future drug royalties as intangible, esoteric streams, if they thought of them as capital assets at all. Legorreta and his team had to patiently convince universities, inventors, and struggling companies that monetizing a fraction of a future revenue stream today could fund the next generation of scientific breakthroughs. By writing massive, upfront cheques to universities, research hospitals, biotech pioneers, and charitable organizations, Royalty Pharma acquired senior, unsecured claims on the top-line revenues of the world’s most essential medicines. They do not invent the drugs, they do not own the laboratories, and they carry zero manufacturing liabilities. Instead, they own the permanent financial tollbooth through which medical progress must pass.
They began small, quietly building a portfolio by acquiring single-digit percentages of early commercialized therapies. They were establishing a playbook defined by rigorous scientific diligence, mathematical precision regarding patent cliffs, and an asset-light posture that avoided the bloated overhead of traditional pharma. They weren’t betting on whether a molecule would work—they were underwriting its commercial durability after it had already proven its worth to patients. If the late 1990s and 2000s were about proving the business model, the defining watershed moment that vaulted Royalty Pharma into institutional titan status arrived in 2014.
The Cystic Fibrosis Foundation (CFF) had long practiced a visionary form of venture philanthropy, deploying early-stage capital to help biotech pioneer Vertex Pharmaceuticals develop life-altering therapies for cystic fibrosis. By 2014, the investment had paid off brilliantly, leaving the non-profit foundation holding a massive, highly valuable royalty stream tied to Vertex’s revolutionary CF portfolio. However, the foundation faced a dilemma: its mandate was to cure a disease now, which required vast, immediate liquidity to fund aggressive global research, rather than waiting decades to collect checks trickling in quarter by quarter. Royalty Pharma stepped in with an audacious $3.3 billion transaction, purchasing those royalty rights outright. At the time, it was hailed as the largest financial return ever achieved for a charitable organization combating a disease. For Royalty Pharma, the CFF transaction was a masterclass in capital allocation and scale. It permanently cemented the firm’s reputation as the premier counterparty for multi-billion-dollar monetization events. It injected long-duration, high-margin cash flows onto their balance sheet, giving them the heft, investment-grade footing, and credibility to eventually march toward their 2020 IPO.
Royalty Pharma’s portfolio spans multiple high-barrier therapeutic areas, mitigating concentration risk while capturing secular tailwinds in aging global populations. The cystic fibrosis franchise, anchored by Vertex Pharmaceuticals, represents approximately 29% percent of total revenues and continues to exhibit durable pricing power and near-monopolistic treatment adherence. In respiratory and immunology, GSK’s Trelegy Ellipta for chronic obstructive pulmonary disease and asthma alongside Johnson & Johnson’s Tremfya for plaque psoriasis and psoriatic arthritis deliver high-margin, double-digit prescription growth. Meanwhile, recent oncology and rare disease additions like Agios’s Voranigo for IDH-mutant glioma and Roche’s Evrysdi for spinal muscular atrophy provide long-duration royalty tails extending well into the 2030s and 2040s.
Investment Philosophy & Economic Moat: Why the Royalty Model Wins
At ROCKLINC, our investing framework prioritizes businesses with wide economic moats, predictable revenues, high returns on capital, pricing power, and robust balance sheets that can withstand macroeconomic cycles. Royalty Pharma exhibits these characteristics in abundance through several key structural advantages.
First, the firm achieves asymmetric risk mitigation by outsourcing binary failure. Traditional pharmaceutical investing is fraught with binary hazard. If a Phase III clinical trial fails or a newly launched drug hits unexpected safety snags, a biotech stock can crater by seventy percent overnight. Royalty Pharma neutralizes this risk through massive diversification and stepping into the funding process post-approval. By holding royalty interests across more than thirty-five approved blockbuster therapies and nearly twenty clinical pipeline candidates, the failure of any single drug is a minor operational ripple rather than an existential threat.
Second, Royalty Pharma typically holds senior, unsecured claims on top-line revenue. Unlike equity holders in drug developers who stand at the back of the line behind debt holders and operating expenses, Royalty Pharma’s receipts represent a senior contractual claim on gross product sales. Whether a pharmaceutical marketer is squandering cash on bloated marketing campaigns or suffering from margin compression due to rising SG&A costs, Royalty Pharma gets paid right off the top before corporate expenses are even calculated.
Third, the business enjoys asset-light operating leverage. Because Royalty Pharma does not maintain sprawling R&D labs, sales forces, or manufacturing plants, its financial model enjoys pristine operating leverage. Revenue growth flows directly to the bottom line with minimal capital expenditure requirements, allowing the firm to generate extraordinary free cash flow conversion rates year after year. The Company’s main expenditure is that of human capital, employing the very best of talent across its core competencies of medicine, research, investment banking and private equity.
Fourthly, the Company enjoys a monopolistic hold on the industry deal flow, given its size and experience in structuring flexible deals with installment and milestone payments, making it a preferred choice for many royalty sellers. Between 2012 and 2022, 86% of the industry’s deal volume of transactions over $500 million went to Royalty Pharma, with the Company accounting for each of the five largest pharmaceutical royalty transactions in history.
Financial Performance
At its core, Royalty Pharma’s financial performance is driven by a high-margin, capital-light business model that converts top-line royalty collections into predictable cash flow with minimal corporate overhead. Operating and professional expenses historically account for less than 7% of portfolio receipts, allowing the vast majority of cash inflows to flow directly to EBITDA and capital redeployment. Growth continues to be propelled by a balanced mix of mature commercial blockbusters and newly launched therapies across major therapeutic areas. Recent outperformance has been spearheaded by surging demand for key assets such as Tremfya (psoriatic arthritis/ulcerative colitis), Evrysdi (spinal muscular atrophy), and newly launched therapies like Voranigo and Imdelltra, which have consistently offset headwinds from older assets facing generic erosion.
This compounding model has delivered durable long-term expansion, with royalty revenue compounding at an impressive high-single to double-digit CAGR over recent multi-year periods. Because the business requires virtually no maintenance capital expenditures or expensive in-house R&D infrastructure, capital efficiency remains exemplary. This structurally light balance-sheet strain is reflected in Royalty Pharma’s financial metrics, with Return on Equity (ROE) consistently topping 20% and Return on Invested Capital (ROIC) running above 14%. These figures underscore management’s disciplined approach to structuring royalty transactions with strong downside protection and highly attractive risk-adjusted hurdles.
From a valuation standpoint, Royalty Pharma trades at a compelling discount relative to both traditional pharmaceutical peers and broader financial royalty aggregators. Shares currently priced in the low-to-mid teens on an EV/EBITDA basis offer an asymmetric entry point for an asset generating high-quality, long-duration cash flow. From a price-to-earnings perspective, the business is trading at 10x earnings, attractive for a financing business with 20%+ returns on equity. Management has actively exploited this valuation disconnect by aggressively deploying excess cash into share repurchases, executing over $1.2 billion in share repurchases in 2025 alone. Since first implementing its inaugural share repurchase program in 2023, Royalty Pharma has bought back approximately 11.5% of the company at prices much lower than where the stock is trading today, propelling free cash per share growth.
In conclusion, Royalty Pharma represents a rare financial hybrid, combining the safety and predictability of a high-grade predictable toll collector on an ageing global population with the secular growth upside of cutting-edge global biotechnology. By providing immediate liquidity, Royalty Pharma allows biopharma partners to scale development, expand clinical trial scope, or launch therapies much faster. This speed ensures that breakthrough treatments for oncology, rare diseases, immunology, and neuroscience reach critically ill patients sooner. Trading at attractive cash-flow multiples with a fortress balance sheet, ongoing share repurchases, and an expanding portfolio of life-saving blockbusters, RPRX offers an exceptional margin of safety for long-term investors seeking compounding wealth protection and growth.
E. Moving Forward
We continue to keep our eyes focused on the fundamentals of the businesses we invest in, within the context of a struggling global economy. We will do our best to take advantage of sharp moves in the market! We currently have eight full-time employees. Here is our organizational chart.
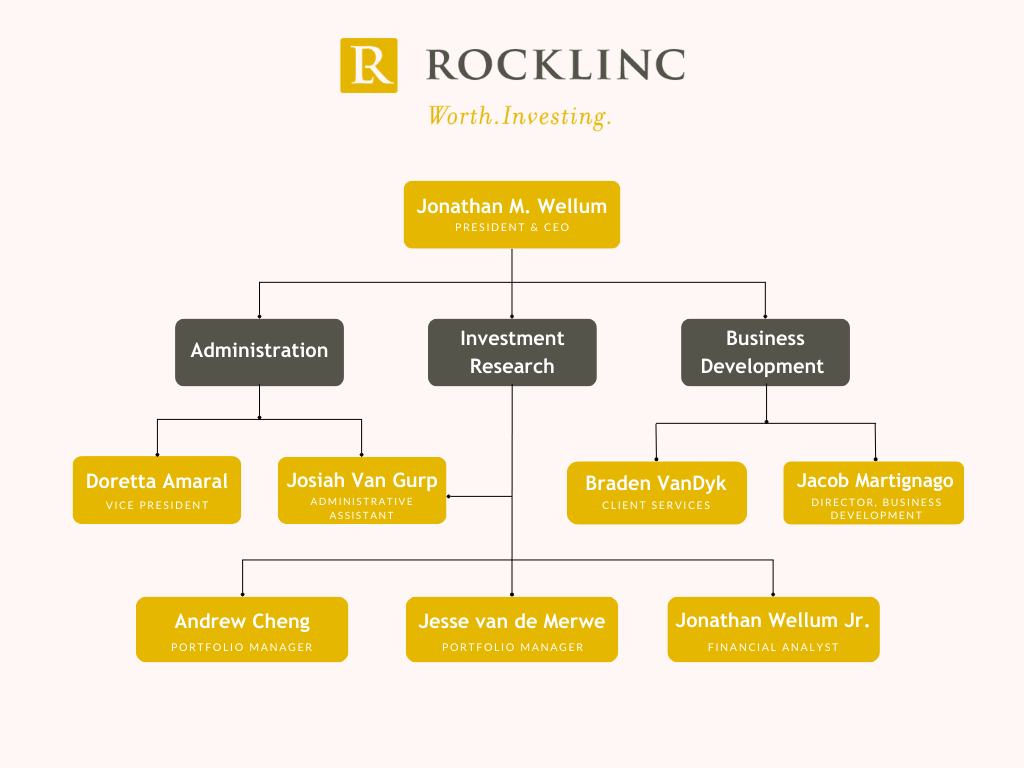
The investment team at Rocklinc is diligently managing our portfolio companies to meet or exceed expectations while seeking new opportunities to enhance your investments. Despite tariffs, trade tensions, or military activities, our core strategy remains unchanged: building portfolios of exceptional businesses. Below are ten key principles guiding our approach:
- Patience: We wait for attractively priced opportunities, leveraging our cash reserves to buy low during volatile periods. Tariff-related uncertainty, along with hostilities in the Middle-East and Europe may create short-term noise but also long-term opportunities. Quality companies at compelling valuations reward investors who focus on fundamentals, not headlines.
- Monitor Central Banks: Monetary policies—such as suppressed interest rates and expanding money supply—significantly influence market valuations. Central bank policies are generally not supportive of strong currencies. We will closely monitor the actions of the new Federal Reserve Chair, Kevin Warsh, to assess their potential impact on capital markets.
- Address Unsustainable Deficits: Government deficits pose risks to purchasing power. We maintain significant positions in precious metals and hard assets to mitigate these risks, despite volatility.
- Diversify Strategically: Our focused portfolios (25-30 securities) are diversified across asset classes, sectors, and regions to balance risk and opportunity.
- Prioritize Strong Balance Sheets: We invest in companies with tangible assets, robust financials, and minimal counterparty risk.
- Focus on Essential Industries: We target firms in growing sectors with long-term secular trends.
- Avoid High-Risk Firms: We minimize exposure to heavily leveraged financial companies with complex balance sheets, such as banks and insurers.
- Maintain Liquidity: Adequate cash reserves allow us to capitalize on market dislocations, earning 3.0% – 4.0% annually while preserving flexibility.
- Stay Opportunistic: We remain positive and proactive, grounded in realism and truth.
- Anchor in Faith: “Blessed is the man who trusts in the Lord, whose trust is the Lord.
He is like a tree planted by water, that sends out its roots by the stream, and does not fear when heat comes, for its leaves remain green, and is not anxious in the year of drought, for it does not cease to bear fruit.” Jeremiah 17:7-8 ESV
For questions about your account, please contact us to schedule an appointment.
ROCKLINC INVESTMENT PARTNERS INC.
Contact Information
ROCKLINC INVESTMENT PARTNERS INC.
4200 South Service Road, Suite 102
Burlington, Ontario
L7L 4X5
Tel: 905-631-LINC (5462)
www.rocklinc.com
| Doretta Amaral | damaral@rocklinc.com | (ext. 1) |
| Jonathan Wellum | jwellum@rocklinc.com | (ext. 2) |
| Jesse van de Merwe | jvandemerwe@rocklinc.com | (ext. 3) |
| Braden Van Dyk | bvandyk@rocklinc.com | (ext. 4) |
| Andrew Cheng | acheng@rocklinc.com | (ext. 5) |
| Jacob Martignago | jmartignago@rocklinc.com | (ext. 6) |
| Jonathan Wellum Jr. | jwellumjr@rocklinc.com | (ext. 7) |
| Josiah Van Gurp | jvangurp@rocklinc.com | (ext. 8) |
Disclaimer