A. North American Equity Market Statistics
During the first quarter, the Canadian equity market as measured by the S&P/TSX increased by 6.4%. Year-over-year, the index increased 13%, including dividends. The markets continued to be preoccupied with Central Banks as they focused on inflation and how to get it down to more “acceptable levels”. The large rise in interest rates throughout most of 2023 weighed heavily on capital intensive businesses that typically utilize higher levels of debt on their balance sheets. This included banks, real estate businesses along with utilities/infrastructure companies. As we discussed in our last two quarterly reports, some of the businesses we own including infrastructure and precious metals businesses struggled throughout much of 2023, finally rebounding in November and December. For the first quarter of this year these same businesses continued to make solid advances despite a reversal in interest rates in February and March, as inflationary concerns returned.
As we mentioned in our fourth quarter report, several of our favourite businesses continue to trade at substantial discounts to what we believe is their intrinsic value. This is providing us with unique opportunities to increase our weightings in these companies. Here are eleven businesses that we believe are trading at greater than 20% discounts with several trading at greater than 30% discounts to intrinsic value: Agnico Eagle Mines, Altius Minerals, APi Group, Brookfield Corporation, Brookfield Infrastructure, Brookfield Renewable, Franco-Nevada Corporation, MEG Energy, Sandstorm Gold Ltd, Trisura Group and Wheaton Precious Metals. Expect to see us judiciously add to some of these businesses along with others in the second quarter.
Canadian Equities
During the first quarter our basket of Canadian companies (after all expenses) increased by 5.2% and over the past 5 and 10 years, compounded annually at 9.1% and 8.5%, respectively. While underperforming the index by 1.2% during the first quarter, we have outperformed the index by approximately 0.1% and 1.7% annually over the past 5 and 10 years, respectively. Our weighting in the precious metals royalty companies, along with our large weighting in infrastructure businesses, added significant value over the last five and ten years but held us back in 2023 given the large rise in interest rates and the strong US dollar. This trend has reversed in the first quarter as interest rates have settled down and the fundamentals of the businesses have taken over. Regardless of the short-term noise, our focus is on the long-term economic fundamentals of the companies we own. We are pleased with our core positions and their favourable long-term fundamentals and continue to finetune our positions month-by-month.
In terms of the S&P/TSX index, nine of the eleven sectors generated positive returns during the first quarter. Their returns from best to worst: Health Care (17.7%), Energy (11.7%), Industrials (10.8%), Materials (5.4%), Information Technology (4.8%), Financials (4.4%), Consumer Discretionary (4.0%), Consumer Staples (3.6%), Real Estate (0.8%), Utilities (-2.3%), and Communication Services (-10.0%).
US Equities
During the first quarter of 2024, our portfolio of U.S. based companies (after all expenses) increased by 7.7% and over the past 5 and 10 years, compounded annually at 10.5% and 13.2%, respectively. During the quarter we underperformed the S&P 500 index by approximately 2.9% but outperformed the Dow Jones Industrial Average (DJIA) by 2.0%. The challenge with the S & P 500 index is that it continues to be dominated by a handful (7-10 companies) that have driven the index. We refuse to chase stocks and we will not buy stocks based on momentum. The basket of companies we own represent reasonable value and possess the characteristics to outperform other businesses in the coming years.
Over the past 5 years, we have trailed the S&P 500 index by 4.5% and over the past 10 years outperformed the index by .3% annually. When compared to the DJIA we outperformed the index by 1.6% and 4.0% over the past 5 and 10 years.
Most recently, the returns in the U.S. markets have been dominated by a handful of businesses. Most of them are trading at extremely high valuations, propelled by the excitement surrounding artificial intelligence (AI). There is no question that AI will have a massive influence on our society and many business but that does not give us license to chase overvalued securities. It is our longterm discipline that will produce the consistent returns demanded by our investors.
Major contributors to our long-term performance include businesses operating in the following sectors; consumer staples, healthcare, industrial, manufacturing precious metals, and technology. Given the size of the U.S. market, most of the new holdings we have added to our portfolios over the past 2-3 years have been global businesses domiciled in the U.S. But we continue to scour the world for opportunities. Recently we added APi Group (see investment overview of this company later in this report) to our portfolio, which is headquartered in New Brighton, Minnesota.
Market Statistics
Pertinent market action during the first quarter of 2024 and during the last 12 months is captured in the following table.
| Mar. 31, 2023 | Dec. 31, 2023 | Mar. 31, 2024 | 3 Month Return | 1 Year Return | |
| CAD/USD | $0.7378 | $0.7547 | $0.7381 | -2.20% | +0.04% |
| Oil WTI (US $) | $76.58 | $71.29 | $83.02 | +16.45% | +8.41% |
| Gold (US $) | $1,797.55 | $2,062.98 | $2,220.37 | +7.63% | +23.52% |
| Silver (US $) | $23.33 | $23.79 | $24.87 | +4.54% | +6.60% |
| S&P/TSX | 19,385 | 20,958 | 22,178 | +5.82% | +14.41% |
| S&P 500 | 3,840 | 4,770 | 5,254 | +10.15% | +36.83% |
| Cdn 10 yr. | 3.30% | 3.10% | 3.47% | +37 bps | +17 bps |
| US 10 yr. | 3.87% | 3.88% | 4.20% | +32 bps | +33 bps |
During the first quarter, the Canadian dollar decreased by 2.2% against the USD and was unchanged over the last twelve months. The USD continues to be quite strong and has advanced against every major currency in the world over the past three years. Don’t confuse this with the a strong dollar!
The US fiscal situation is atrocious with the US adding to its massive $34 trillion debt at a rate of $2 trillion per year! The interest on their debt is now their largest line item at over $1 trillion per year. Let that sink in for a moment. So if the US dollar is strong, it is only an indication of how weak the other currencies around the world are performing! No wonder gold and some of the cryptocurrencies are trading at record highs.
As more and more countries around the world seek to de-dollarize, that is, avoid the U.S. dollar when trading goods in the international markets, the U.S. dollar will come under pressure and may weaken relative to other major currencies. This does not mean that the U.S. dollar will lose its reserve currency status any time soon. Given the ugly alternatives, the U.S. dollar still looks relatively attractive. What is more important for investors is that the U.S. dollar, and other fiat currencies, like the Canadian dollar, will weaken relative to hard assets such as copper, nickel, oil, gas, gold and silver. This is why we own businesses that are backed by hard assets, precious metals and some strategic base metals.
The best way to minimize currency risk is to buy strong and growing businesses that generate revenue in numerous currencies and are backed by hard tangible assets. As a result, these businesses create a natural currency hedge in your portfolio and mitigate the impact of fluctuating currencies and inflation. Our view, which we have held for the past 14 years, is that all fiat currencies will continue to lose value against tangible, or real, assets. This is because governments around the world are fiscally irresponsible (run large budget deficits and accumulate large debts), and through their central banks, continue to print record amounts (through the whole business cycle) of money to support their indebted economies.
During the quarter, gold jumped by 7.6% and was up 23.5% over the past twelve months. It finished the quarter at a new high of $2,220.37. At the time of writing this report, gold is trading well in excess of $2,300. Silver was also stronger during the quarter and increased by 4.5% and was up by 6.6% over the past year. We believe the long-term trends for both of these precious metals are to the upside and we continue to build positions in this sector. Our major positions continue to be royalty companies Franco-Nevada, Gold Royalty Corp., Osisko Royalties, Royal Gold, Sandstorm Gold, Wheaton Precious Metals and leading miner Agnico Eagle Mines. While almost all of these increased during the first quarter, they have underperformed the broader market indexes for the past three years due to the rapid rise in interest rates and US dollar strength. This underperformance has now ended and these businesses are beautifully positioned to benefit from global turmoil, overindulgent governments and rising precious metals prices. Currently, they are trading at substantial discounts to intrinsic value with several trading at massive discounts. Expect us to add to your positions.
During the quarter, oil jumped by 16.5%. Year-over-year, oil was up by 8.4%. Currently, oil prices are averaging $85-$90 per barrel which is very profitable for the industry and the companies we own in your portfolios. Continued geopolitical shocks will only increase the price of each barrel of oil and drive up the value of our oil investments. Our direct investments in the oil and gas sector remain relatively small (less than 6%) and we continue to look at ways to profit from the foolhearty “green agenda”.
During the first quarter, interest rates sharply reversed course and jumped back up again as the rate of inflation started to edge higher. The 10-year Canadian bond increased by 37 bps and the US 10-year treasury increased by 32 bps during the quarter. Year-over-year, the yields were up 17 bps and up 33 bps on the 10-year Canadian bond and the 10-year US bond, respectively. With the reckless spending on the part of many governments including the Canadian and US governments, inflation is remaining stubbornly high. At this point, it appears that interest rates will settle in at these levels. At some point, the financial system will buckle under the weight of these interest rates due to the massive amount of global debt. While we have been surprised by the resiliency of the global economy, largely supported by the fiscal irresponsibility of national governments, the deficits cannot continue at the current levels and indebted consumers will continue to slow down their spending. When this happens, we will see a meaningful slowdown in our economy and a retrenchment in the level of interest rates which should benefit your investment portfolios.
B. ROCKLINC Investment Update
Private Client Assets – Separately Managed Accounts
In terms of our ROCKLINC separately managed accounts, they increased by 4.4% during the first quarter and increased by 6.3% during the last 12 months (period ending March 31, 2024). More importantly, our average annual compound rate of return over the past 3, 5 and 10 years is clocking in at approximately 3.3%, 6.9% and 7.2%, respectively. Returns are after all fees, and are based on an asset mix of approximately 65% invested in equities, with the remainder invested in short-term deposit accounts and short-term bonds. Please note that the performance we are disclosing is our aggregate performance across all our accounts. Each client’s portfolio is unique and performance will vary, based on your risk tolerance and your specific asset allocation.
When we dig further into our numbers, we find that our basket of equities (Canadian and U.S.) were up by approximately 6.1% during the first quarter and up by approximately 7.5% during the past 12 months. Our equities have been compounding by approximately 10% over the past 5 years and by 10.2% over the past 10 years keeping pace with the major indexes.
We continue to focus on the economic fundamentals of the businesses we own. This means that we first, selectively add companies as our research team ferrets out new opportunities. Second, prune underperforming businesses. Third, take advantage of market swings and add to existing positions at better prices!
During the first quarter, we started to build new positions in APi Group (see write-up later in this report) and Cameco. We also added significantly to Trisura, MEG Energy, Schneider Electric and several of our precious metals companies. We trimmed positions in American Tower, Church & Dwight, Suncor Energy along with our exposure to two REITS. Over the past 6 months, we have been very active in working to ensure we are in the best businesses we can find. That means we are looking for businesses that are growing quickly, have strong balance sheets and are trading at attractive prices.
ROCKLINC Partners Fund
Over the past two years we have been utilizing the Partners Fund in more of the portfolios we manage. The Fund offers our clients a low cost and efficient way to purchase our top 20-30 companies in one portfolio. It is an effective way to gain access to a global diversified portfolio with modest amounts of investment capital. Our number one objective is to create a Fund comprised of excellent companies that produce strong long-term performance.
Quarterly, we provide a performance update to our clients. Performance numbers are after all fees and rates of return beyond one year are annual compound rates of return. Currently, the Fund is 22% in cash and short-term money market instruments (yielding 4.5-5%), 75.5% in publicly traded equities and 2.5% in one private equity investment. We expect our cash weighting to slowly trend lower during 2024.
During the first quarter we added five new companies to the portfolio and sold three companies from the portfolio. We established new positions in Agnico Eagle Mines, APi Group, Brookfield Corporation, Cameco Corp and Gastronomous Technologies. Agnico Eagle is one of the world’s premier gold mining companies and Cameco is one of the world’s leading uranium companies. We remain very bullish on gold given the growing indebtedness of the world and we believe that nuclear energy will become a much larger contributor to the generation of energy in the next decade and beyond. Please refer to our company profile in this newsletter for more information on APi Group.
Investors in the Partners Fund will be interested to know that late in the quarter we invested $300,000 USD ($405,000 CDN) into our first private company called Gastronomous Technologies. Although our Offering Memorandum allows us to invest up to 10% of the portfolio in private businesses, it is not our intention to invest more than 5% in private equity. Currently, Gastronomous represents 2.5% of the total portfolio. As the Fund continues to grow we expect the weighting in this company to be closer to 1.5% of the Fund by the end of this year.
Gastronomous is a technology company bringing automation to the quick service restaurant (QSR) industry. The company’s flagship product is an automated grilling machine that can be installed in restaurants that cook a wide variety of meat products. Currently, the firm has been working with Harvey’s and has automated grills in two of their locations. The testing of the grill has gone exceptionally well and we expect a roll out to many of the Harvey’s locations late this year and in 2025. The company is also working closely with Tim Hortons to provide them with an automated system that integrates with their point of sale equipment and fills all of their coffee orders with limited human interaction. The first automated system is expected to go live in Tim Hortons corporate store in Oakville this month (April). Automation in the QSR industry has been slow in coming and we are excited with the prospects for this firm as they help the industry maintain profitability in a highly competitive low margin industry. For example, their automated grilling solution will reduce labour and energy costs, enhance food safety, reduce waste, increase efficiencies and throughput and produce a more consistent and higher quality product. As the company continues to grow and expand their reach we will update our investors on their progress.
In order to make room for our five new additions, we eliminated American Tower Corp, Church & Dwight Co. and Suncor Energy Inc. While each of these companies are great businesses they were sold to make room for businesses we believe offer stronger long-term rates of return for our investors. In the case of Suncor Energy, we decided to double our position in MEG Energy by selling our position in Suncor. Why MEG? Simply stated, MEG is growing more quickly and trades at a lower valuation than Suncor.
During the first quarter we added to many of our existing positions as money continued to flow into the Fund. In particular we added to our position in Trisura which is now our largest position at 11.1% of the Fund up from 8.3% of the Fund at the end of 2023.
After all expenses and fees, the Rocklinc Partners Fund has been compounding at approximately 7.0% per year since inception (six years and three months) and 7.9% over the past five years.
When you look through to the equities in the portfolio, the Canadian stocks have been compounding at 11.3% and the U.S. equities have been compounding at 11.6% over the past five years. During the same five-year period, the S&P/TSX total return index compounded at 9%, the S&P 500 compounded at 15% and the Dow Jones Industrial Average at 8.95%.
Our top 12 holdings represent approximately 54% of the total portfolio and 70% of the equity weighting in the portfolio. The top 12 holdings are Trisura Group (11.3%), Amazon (5.5%), MEG Energy (5.5%), Apple Inc (5.2%), Brookfield Infrastructure Partners (4.6%), Franco-Nevada (3.8%), Roper Technologies (3.4%), Wheaton Precious Metals (3.3%), Danaher Corporation (3.2%), Brookfield Renewable (2.9%), APi Group (2.7%) and Autodesk (2.7%).
As at March 31, 2024
| 1 mos. | 3 mos. | YTD | 1 yr. | 3 yr. | 5 yr. | |
| RL Partners** | 2.6% | 6.5% | 6.5% | 10.2% | 3.8% | 7.9% |
ROCKLINC Kokomo Fund
In order to assist some of our clients and provide them with an investment product that is regulated and registered outside of Canada, we launched our Rocklinc Kokomo Fund in November 2022. Our Kokomo Fund is registered in the Cayman Islands and all funds are held in custody in Grand Cayman. It is important to point out that the Cayman Islands are a British Overseas Territory and the world’s number one offshore market for investment funds.
The Fund Custodian for the Rocklinc Kokomo Fund is FundBank, the Fund Administrator is SGGG Fund Services (Cayman) Inc., the Fund’s legal counsel is Carey Olsen, and Fund’s Auditor is Grant Thornton (Cayman). The minimum investment is $100,000 USD. The Net Asset Value (NAV) of the Fund is priced monthly and started at $100.00 per unit. We are managing the portfolio in a similar manner to how we manage all our discretionary accounts. This will include 20-25 stocks, low turnover, a competitive management fee, no performance fees and monthly pricing and liquidity. Offering documents are available on our website or by calling us at ROCKLINC.
We started making investments in the portfolio in February 2023 and continue to add slowly to our core positions. As at March 31, 2024, the Fund had a total value of approximately $4.00 million USD. The units closed at a record high of $107.55 at the end of the first quarter. There has been a consistent flow of money into the Fund providing us with tremendous opportunities to add to our existing positions, trim underperforming businesses, and add new positions to the portfolio. Client interest is very strong and we are continuing to add 2-3 new clients into the portfolio each month.
As of March 31st, we have 20 equity positions in the portfolio representing approximately 75% of the total value of the assets. The remaining 25% is invested in a money market fund currently earning approximately 5% per year. Our objective is to keep the number of equities in the portfolio around 20 and not more than 25, and increase the equity weighting up to 85-90% based on buying opportunities and valuations. We are patiently adding to our equity weights, while keeping cash on the sidelines.
During the first quarter, we eliminated our position in Suncor Energy and rolled the proceeds into MEG Energy. We believe that MEG Energy offers a higher rate of return over the next 3-5 years and allows us to maintain our weighting in the oil and gas sector. We took some profits on Intercontinental Exchange and added Brookfield Corporation to the portfolio. At current valuations, Brookfield Corp offers our investors a higher rate of return over the next few years. Lastly, we established a position in Gold Royalty Corporation. The company is a gold focused royalty company with a diversified portfolio of more than 200 royalties located in mining friendly jurisdictions throughout the Americas. The company has an exceptional portfolio of royalties, a seasoned executive team and an absurdly low valuation. It was the ridiculously low valuation that compelled us to add the company to the Fund. We starting buying in February and added to our position in March. Year-to-date, the stock price is up 40% and over the next 18-24 months we expect the stock to double from its current price just based on the increasing royalty streams the company is expected to generate.
Our top 10 companies in the portfolio by portfolio weighting are Trisura Group Ltd, Brookfield Infrastructure, MEG Energy, Amazon, Danaher Corp., Brookfield Renewable, CoStar Group, Osisko Royalties, Wheaton Precious Metals and AutoDesk. These businesses represent approximately 50% of the total portfolio and 67% of the active equity weighting in the portfolio.
C. Company Update – APi Group (APG)

On the afternoon of March 25, 1911, a fire erupted on the 8th floor of the Asch Building in Manhattan’s Greenwich village, claiming 146 lives. The majority of victims were young immigrant women employed by the Triangle Waist Company, known for manufacturing shirtwaists. The company occupied the 8th, 9th, and 10th floors of the building, which was hailed by its owner as “fireproof.” Although the exact cause of the fire remains unknown, investigators found a number of critical deficiencies in the building. The building had no sprinklers, there was only one fire escape, and most notably, the exit doors leading to the building’s two stairwells had been locked as a preventative measure to prevent employee theft. The seriousness of the fire led Governor John Alden Dix to establish New York’s Factory Investigating Commission, which resulted in the implementation of stricter workplace and safety laws. These included improved ventilation, sanitation, and fire safety measures such as mandatory sprinkler systems, fire drills and smoking bans. It was this tragedy that inspired what is known today as the NFPA (National Fire Protection Association) 101, Life Safety Code1, one of the most recognized safety codes in the world.
Today, this code applies to the majority of public spaces, including office buildings, shopping malls, schools and restaurants. Even if spaces are not being used, the regulations still apply. For example, during the recent COVID-19 lockdowns, many businesses ceased operations, transitioning employees to remote work, which left many commercial spaces vacant. Despite prolonged vacancy periods, regulations mandating annual inspections for critical life safety systems and equipment, including fire protection solutions, Heating, Ventilation, and Air Conditioning (HVAC), and entry systems remained in place. With associations like the NFPA and other government agencies continually adopting new and more stringent regulations, the pressure on businesses to ensure compliance continues to grow. This highly regulated environment has opened up significant opportunities for companies like APi Group. APi is the global leader in life safety services, helping businesses navigate the increasing and complex web of health and safety regulations.
Despite its short life as a public company, APi has a long and storied history. The company was founded in 1926 by Reuben L. Anderson in St. Paul, Minnesota. It began as a small insulation contracting and distribution business focused on consolidating companies in order to provide a full suite of services for their customers. After graduating from West Point in 1961, Reuben’s son Lee Anderson, bound for a career in the military, returned to Minnesota to lead the company after his father suffered a heart attack. Lee was appointed president in 1964 and immediately began acquiring firms in the construction and fire-protection fields where he saw substantial growth opportunities. Since 2005, APi has completed over 100 acquisitions, adding several quality companies to their portfolio of brands, such as Chubb Fire & Safety, SK FireSafety Group, and International Fire Protection Inc. These acquisitions has allowed them to take significant market share from competitors while expanding their presence into new global markets. In 2019, Lee sold his interest in APi Group for $2.9 billion to J2 Acquisition Limited, a SPAC (Special Purpose Acquisition Company) led by Sir Martin Franklin, James Lille and Ian Ashken. The company went public through the SPAC and all three men serve as board members.
Now headquartered in New Brighton, 15-miles north of St Paul, Minnesota, APi operates through two segments: Safety services, which account for approximately 70% of revenues and Specialty services, which represent approximately 30% of revenues. In the Safety segment, the company designs, installs, inspects, and services various fire protection solutions, life safety equipment, and HVAC systems for a wide array of customers. Inspections are required by regulatory bodies (i.e. fire marshals, US government), to be done at least once a year, creating a recurring fee based revenue for the firm. Currently, inspection, service and monitoring fees comprise approximately 50% of the firm’s revenues. The target is to reach at least 60% by 2025. As the percentage of service income increases, gross margins are expected to increase by an additional 10-20%.
In the Specialty segment, the company provides maintenance, repair and retrofitting services to critical infrastructure such as underground electric, gas, water, sewer, and telecommunications infrastructure to ensure proper functionality. Customers in the segment vary from private and public utilities, healthcare, education, transportation, manufacturing, and government. The two segments complement each other nicely and will often encompass the same customers due to cross-selling capabilities, enabling APi to service the entire facility life cycle. Buildings require inspection and monitoring of their infrastructure across their entire premises, from storm drain and sewer pipes underground, all the way up to fire sprinkler heads and security cameras on the ceiling.
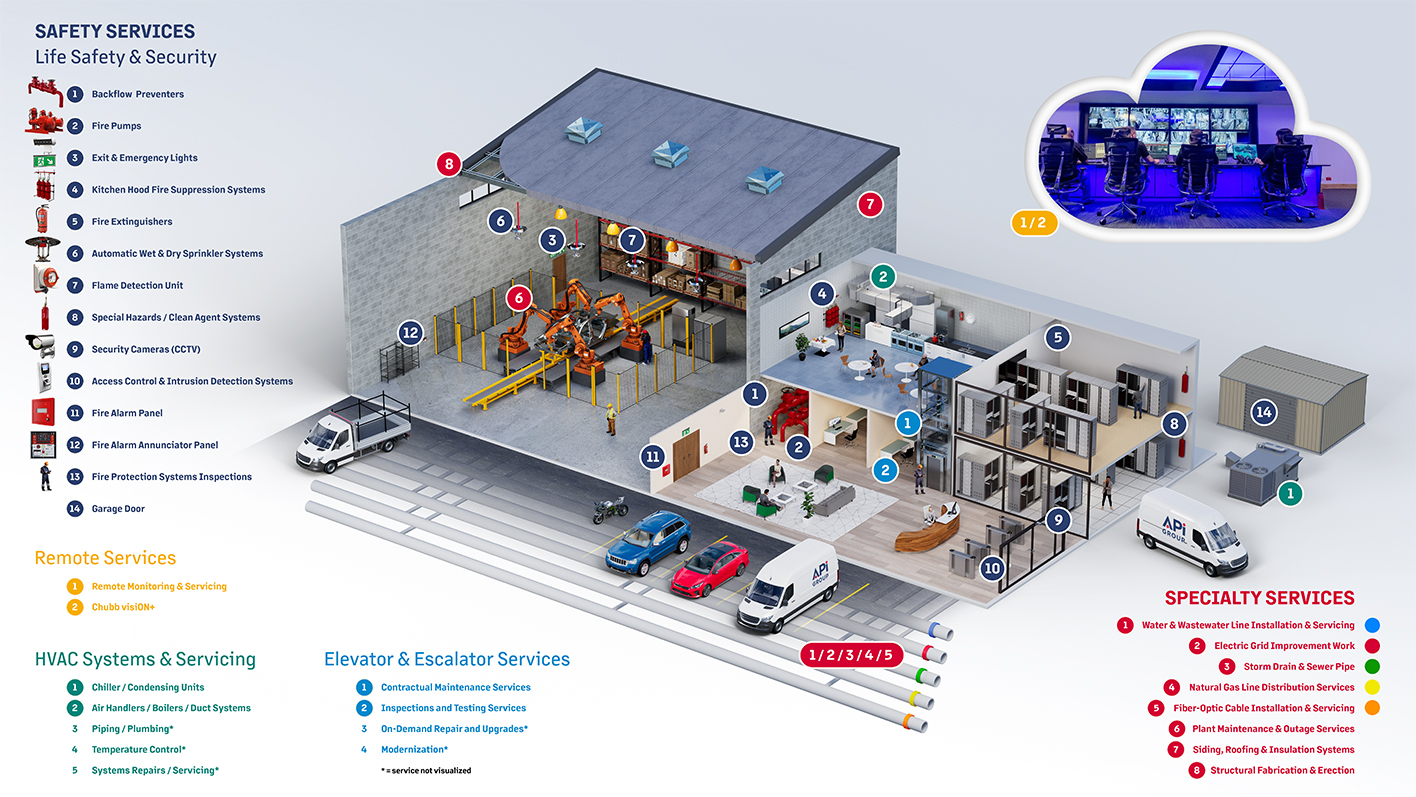
APi stands apart from competitors due to its go-to-market strategy of targeting smaller-ticket work to existing facilities and offering quality inspection services first. Management believes on average, every $1 of core inspection work leads to $3-4 of future non-inspection service work, ultimately creating very sticky and strong relationships with customers. In contrast, competitors pursue winning bids for higher-ticket installations on new builds, then sell their inspection services once approximately 95% of the construction work is complete. APi’s strategy seems to be working well with customer retention rates of over 90% and a large untapped market ahead of them. Currently, the company holds a 10% market share in the US inspection and service market, and is the market leader, with a 5% market share, in the >$60 billion global fire protection systems market. Given APi’s size, they have the scale to continue investing in leading technology allowing them to win larger enterprise customers and drive their market share even higher. For example, APi’s technology was the first to provide their clients with the ability to generate same-day inspection deficiency reports for customers, ensuring they’re compliant with local regulations and up to date on their insurance requirements each year.
Since the great financial crisis in 2008, management has directed its focus towards shifting the business away from cyclical, capital-intensive projects and installation work to more defensive, asset-light service work, driving APi into a stable, higher margin, recurring revenue business with greater pricing power. Inspection and service work increased from 15% of revenue in 2008 to 53% at the end of 2023 and continues to grow quickly. Part of this growth is due to increased regulatory requirements in recent years, which have become more onerous for businesses. The NFPA, has more than 300 requirements and codes for new construction, including the installation of sprinkler systems, national fire alarms, signaling codes, etc., which are on average updated every 3-5 years. Meanwhile, the US government is continuously reviewing expanded regulations and essential safety mandates along with state and local governments. These trends have created a meaningful tailwind for APi Group with inspection, service and monitoring revenues growing by double-digits every quarter since 2020!
Another significant contributor to APi’s transition towards a more service and inspection-oriented company was the acquisition of Chubb Fire and Security, a global market-leading safety and security business. In its long history of acquiring comparable companies, APi had never undertaken an acquisition as transformative as Chubb, which management described as a ‘center of the fairway’ transaction. APi announced the acquisition in July of 2021, from Carrier Global for $3.1 billion which closed at the beginning of 2022. Under Carrier’s safety services arm, Chubb was largely a neglected asset that suffered years of decline due to significant underinvestment and mismanagement. For context, Chubb operates in 17 countries, serving over 1.5 million customer sites through 200 branches. Their top 6 markets comprise 90% of their revenue, with over 60% of revenue coming from high-margin recurring services, making it a perfect target for an APi takeover. Since the acquisition, APi has been busy with integration, which has led to more than $40 million in cost savings to date, with expectations of an incremental $80-85 million in savings over the next two years.
Over the last decade, the company has built itself into a defensive, non-cyclical, asset-light, service-oriented, recurring-revenue focused business. This positioning has clearly established APi as the dominant leader in a highly fragmented market, ripe for consolidation. We’re also pleased with the quality management team. Russ Becker, the company’s veteran CEO, is committed to creating a culture of leadership across the organization, whereby everyone in the APi family is known and recognized as a leader, from the field-service inspector all the way up to senior management. Russ and the co-chairman have aligned themselves with the the company and together own approximately 15% of the company. Most importantly, the company generates significant free cash flow for shareholders. With the integration of Chubb and the ongoing growth in the business, the stock increased by 86% in 2023, and at the time of writing is up almost 20% year-to-date. Moving forward, the free cash flow will be used for bolt-on acquisitions, share buybacks, and reinvesting back into their business. As a new addition to our client accounts, we are excited with the future of APi and will continue to add to our position in both client portfolios and our ROCKLINC Partners Fund.
D. Moving Forward
We continue to keep our eyes focused on the fundamentals of the businesses we invest in, within the context of a struggling global economy absorbed in debt. We will do our best to take advantage of sharp moves in the market!
The investment team at ROCKLINC is working hard to make sure our existing companies are performing as expected or better and searching for new companies that we can add to your portfolios. APi Group is an example of the kind of business we want to own for the next few years. Over the past year, we have added several new companies to our mix. These include, Progressive Corporation (initiated March 2023), Trisura Group (initiated June 2023), Danaher Corp (initiated August 2023) Schneider Electric (initiated in November 2023), APi Group and Cameco (both initiated in February 2024) and in our Rocklinc Partners Fund we added Gastronomous Technologies in late March.
During the same period, we eliminated/reduced several positions including American Tower, Honeywell International, Intercontinental Exchange, Northland Power Inc., Suncor Energy and TransAlta Renewable (bought out by parent company) We continue to add to businesses trading at the largest discounts to fair market value.
Within the current environment our basic strategy is as follows:
- Patience – we need to wait for well-priced opportunities. Our patience and cash positions give us the flexibility to buy low.
- Watch the world’s leading Central Banks. Interest rates are staying higher for longer and inflation is remaining elevated. As a result, Central Banks are holding rates constant for the next few months. Any interest rate volatility will be used to add to our favourite positions at the best prices.
- Pay attention to the irresponsible decisions of governments around the world. Governments continue to run massive deficits that are not sustainable. This means our purchasing power will remain under pressure and standards of living will continue to drop.
- Diversify across asset classes, sectors and geographic regions. While we run focused portfolios (20-30 securities), we are also careful to maintain an appropriate level of diversification.
- Invest in businesses with strong balance sheets, backed by hard and tangible assets with limited counterparty risk.
- Invest in firms that produce essential products and services, in growing industries, with well-established long-term secular growth trends. Our highlighted company this quarter APi Group Corporation is an excellent example.
- Avoid/minimize highly leveraged financialized firms that have incomprehensible balance sheets, loaded with risky derivatives. We continue to minimize our exposure to banks and life insurance companies! We have been sounding the alarm on banks for the past decade and the situation only continues to get worse. We are very concerned with the solvency of the banking sector.
- Maintain adequate liquidity in our portfolios, in order to take advantage of significant moves in the stock market. Cash is not trash when the markets become irrational! With the recent rise in rates, the cash (investment savings accounts) we hold in clients’ accounts is earning approximately 5% per year.
- Remain optimistic and opportunistic, seasoned with a dose of reality.
- Place your faith and hope in God and not man or the State. We live in a world of lies, hype and spin and we must not look to this world for truth, meaning, purpose and value. As our Western civilization literally implodes in front of our eyes, because it has turned its back on God, his truth and his blessings, we must do the opposite. In Psalm 62:1-2; King David reminds us “For God alone my soul waits in silence; from him comes my salvation. He alone is my rock and my salvation, my fortress; I shall not be greatly shaken.”
If you have any questions pertaining to your account, please call or email for an appointment.
ROCKLINC INVESTMENT PARTNERS INC.
Contact Information
ROCKLINC INVESTMENT PARTNERS INC.
4200 South Service Road, Suite 102
Burlington, Ontario
L7L 4X5
Tel: 905-631-LINC (5462)
www.rocklinc.com
| Doretta Amaral | damaral@rocklinc.com | (ext. 1) |
| Jonathan Wellum | jwellum@rocklinc.com | (ext. 2) |
| Jesse van de Merwe | jvandemerwe@rocklinc.com | (ext. 3) |
| Braden Van Dyk | bvandyk@rocklinc.com | (ext. 4) |
| Andrew Cheng | acheng@rocklinc.com | (ext. 5) |
| Jacob Martignago | jmartignago@rocklinc.com | (ext. 6) |
| Jonathan Wellum Jr. | jwellumjr@rocklinc.com | (ext. 7) |
Disclaimer
The information contained herein reflects the opinions and projections of ROCKLINC (ROCKLINC) Investment Partners Inc. as of the date of publication, which are subject to change without notice at any time subsequent to the date of issue. ROCKLINC does not represent that any opinion or projection will be realized. All information provided is for informational purposes only and should not be deemed as investment advice or a recommendation to purchase or sell any specific security. While the information presented herein is believed to be reliable, no representation or warranty is made concerning the accuracy of any data presented. This communication is confidential and may not be reproduced without prior written permission from ROCKLINC.
- https://www.nfpa.org/news-blogs-and-articles/blogs/2024/03/01/the-triangle-shirtwaist-factory-fire-of-1911 ↩︎