A. Why Precious Metals Are Essential in America’s Fiscal Reckoning
In the sixteen years from 2010 through 2025, the United States added roughly $63.8 trillion in combined on-balance-sheet deficits and unfunded liabilities, while nominal GDP grew by only $16.3 trillion. Liabilities expanded nearly four times faster than the economy. By the end of 2025, total public debt plus the 75-year present-value shortfalls in Social Security and Medicare will stand at approximately $108.5 trillion. This is roughly 3.5 times annual GDP. These numbers are not forecasts; they are taken from the official Treasury data and the 2025 Trustees Reports. They describe a nation whose financial obligations have outrun its productive capacity for more than sixteen years.
The end of the gold standard in 1971 removed the hard constraint on deficit financing and monetary expansion. This enabled the long-term buildup of debt and unfunded obligations that we see today. It’s interesting to note that annual arithmetic where liabilities expand faster than the economy every single year did not become a permanent feature until 2010. Before then, economic growth, occasional fiscal restraint, and less mature demographic pressures kept the gap from being negative in every year. In short: 1971 marked the beginning of the era that made this possible (fiat currency + expanding entitlements). But 2010 is the year when this trend became an unbroken annual reality leading to the devastating financial condition of the country that backs the reserve currency of the world.
Faced with such a gap, rational investors must ask a simple question: Where do you store wealth when governments can no longer grow their way out of debt? The answer, for centuries, has been gold and other precious metals. Three interlocking reasons make ownership of physical gold, silver, and platinum not merely prudent but imperative given the current economic condition of the world’s leading economies with the US at the forefront.
1. Gold is the ultimate hedge against monetary debasement.
When liabilities grow four times faster than GDP, basic mathematics eventually collides with politics. Politicians, looking to be re-elected, will not slash promised benefits or raise taxes enough to close a $47.5 trillion cumulative net gap. The path of least resistance is the one central banks have followed since 1971: expand the money supply. Every major deficit spike in the table, the $3.1 trillion shortfall in 2020, the $2.8 trillion in 2021, has already been met with balance-sheet expansion (printing of money on the part of the Federal Reserve). Current debt levels, ballooning deficits, and rapidly expanding unfunded liabilities are not anomalies; they’re simply the next chapter in the ongoing story of ever-increasing money printing and the debasement of fiat currency.
Gold cannot be printed. Its supply grows at roughly 1-2 percent per year, a rate dictated by geology and long-term capital commitments rather than a Federal Open Market Committee vote. Throughout history, whenever governments have resorted to inflation to lighten their real debt burden, whether it was the Weimar Germany, America in the 1970s, or Argentina in the 2000s, gold has preserved purchasing power. An investor who held gold from 2010 to 2025 would have watched the dollar lose roughly half its purchasing power against the metal while U.S. liabilities quadrupled relative to growth. In an environment where the “net gap” has been negative every single year except the brief post-COVID rebound, gold is not speculation; it is insurance against the not so quiet tax that inflation imposes on savers.
2. Precious metals provide portfolio insurance when confidence in fiat institutions erodes.
The table below reveals something much deeper than numbers, it reflects a structural breakdown in the intergenerational compact. Unfunded liabilities represent promises made to future retirees that the economy, even at optimistic growth rates, cannot keep. When those promises become visibly unsustainable, as Baby-Boomers fully exit the workforce, markets will price in higher risk premia on U.S. Treasuries, issue credit downgrades, and over time the loss of reserve-currency status for the US dollar.
Gold and silver have always functioned as neutral referees in such crises. They require no counterparty. You do not need a government’s good faith, a bank’s solvency, or a bond rating agency’s opinion. During the 2008–2009 crisis, gold rose 25 percent while equities and long-term bonds collapsed. In 2020, when the deficit hit $3.1 trillion and GDP contracted, gold again acted as the ballast. The 2025 snapshot where $108.5 trillion in total claims are measured against an economy producing roughly $30 trillion of GDP, is telling us that the next stress test will be orders of magnitude larger. Precious metals are the only asset class whose value does not depend on the same fiscal authority that created the problem.
3. Gold restores optionality in an era of forced financial repression.
Central banks and governments facing $108.5 trillion in obligations will try to keep real interest rates low, regulate capital flows, and tax savings more heavily. Financial repression, suppressing yields below inflation, has become policy. In such a world, traditional fixed-income instruments become guaranteed certificates of confiscation. Equities, meanwhile, carry valuation risk if growth remains lacklustre or if higher taxes are imposed to service debt.
Gold sidesteps these traps. It pays no coupon, generates no taxable income until sold, and historically appreciates when real yields turn negative. Platinum and silver add industrial leverage: both are critical to AI spending (data centres), robotics, digitization and green-energy infrastructure, sectors that governments are subsidizing even as they debase their currencies. Owning a basket of physical precious metals therefore gives an investor three simultaneous advantages: a non-correlated store of value, a hedge against policy-induced volatility, and exposure to genuine scarcity in an age of monetary excess.
Critics will object that gold “pays no dividend” and has been volatile. The data refute them. Over the full 2010–2025 period, the volatility of gold was far lower than the volatility of the fiscal gap itself. While politicians zig-zagged from trillion-dollar surpluses that never materialized to trillion-dollar deficits that did, gold simply held its real value. In fact, gold began 2010 at $1,096.20 per oz and finished 2025 at $4,325.60 per oz (both in USD). That’s a 3.95 times growth which translates into a compound annual growth rate of 8.96% per year. Consider the alternative. How did parking your wealth in U.S. Treasuries work out when they consistently delivered negative real returns after inflation in most of those years?
None of this is a forecast of a collapse. It is a statement of probabilities. When liabilities expand at four times the rate of the economy for sixteen straight years, the probability that the system can be stabilized without inflation or default rises toward zero. Gold and precious metals do not solve the underlying fiscal problem; they merely allow individuals to step outside of it. In the end, the choice is not between gold and “the market.” The choice is between an asset whose supply is fixed by nature and one whose supply is fixed by incompetent, arrogant and often corrupt politicians. The numbers in the tables below make that choice stark. Over the next decade, either the United States will restore fiscal discipline, a herculean task, that would benefit every asset class, or it will continue on the path documented from 2010 to 2025. In the second scenario, which the arithmetic overwhelming favours, gold will not merely preserve wealth, it will be one of the few places where wealth can still be preserved at all. This is why we will maintain a significant weight in the precious metals despite market volatility.
United States Fiscal Sustainability Overview (2010–2025)
All figures in billions of USD
Annual Flows: Deficits, Unfunded Liabilities, GDP Growth, and Net Gap
Net Gap = GDP Growth − (Deficit + Unfunded Liabilities)*
A negative Net Gap means total liabilities grew faster than the economy.
| Year | Deficit | Unfunded Liabilities* | GDP Growth | Net Gap* |
| 2010 | 1,294 | ≈2,500 | 571 | −3,223 |
| 2011 | 1,300 | ≈2,500 | 551 | −3,249 |
| 2012 | 1,077 | ≈2,000 | 654 | −2,423 |
| 2013 | 680 | ≈1,800 | 627 | −1,853 |
| 2014 | 485 | ≈1,500 | 727 | −1,258 |
| 2015 | 442 | ≈1,200 | 687 | −955 |
| 2016 | 585 | ≈2,000 | 510 | −2,075 |
| 2017 | 665 | ≈2,500 | 807 | −2,358 |
| 2018 | 779 | ≈3,000 | 1,044 | −2,735 |
| 2019 | 984 | ≈4,000 | 883 | −4,101 |
| 2020 | 3,132 | ≈5,500 | −165 | −8,797 |
| 2021 | 2,775 | ≈4,000 | 2,350 | −4,425 |
| 2022 | 1,376 | ≈3,000 | 2,329 | −2,047 |
| 2023 | 1,695 | ≈2,500 | 1,757 | −2,438 |
| 2024 | 1,817 | ≈2,500 | 1,486 | −2,831 |
| 2025 | 1,775 | ≈2,450 | 1,469 | −2,756 |
| Total | 20,861 | ≈42,950 | 16,287 | ≈−47,524 |
Insights from the Period
- Nominal GDP grew by ≈ $16.3 trillion.
- Combined on-balance-sheet deficits + unfunded liabilities grew by ≈ $63.8 trillion (nearly 4× faster than GDP).
- Unfunded liabilities represent the approximate annual change in the 75-year present value of Social Security (OASDI) + Medicare shortfalls (midpoints of ranges used).
U.S. Debt & Unfunded Liabilities Snapshot – End of 2025 (Trillions USD)
| Description | On-Balance-Sheet Debt | Unfunded Liabilities | Combined Total |
| Baseline (01/01/2010) | 11.9 | ~42 | ~54 |
| + Growth (2010–2025) | +20.9 | +43 | +64 |
| End-2025 Total | 38.5 | ≈70 | ≈108.5 |
Net Position vs. Economy: Total liabilities (debt + unfunded liabilities) now stand at ≈ 3.5× nominal GDP.
Notes
- Unfunded Liabilities: 75-year present value shortfalls for Social Security and Medicare (using midpoints of reported ranges).
- Data Sources: U.S. Treasury (deficits and debt), 2025 Social Security & Medicare Trustees Reports.
- The persistent negative “Net Gap” shows that liabilities have continued to outpace economic growth throughout the period.
- All figures are nominal (not inflation-adjusted).
B. North American Equity Market Statistics
Canadian Equities
In Q1 2025, the Canadian equity market, as measured by the S&P/TSX Total Return Index, rose 3.78%. Over the past year, the index gained 33.9%, including dividends. Our portfolio of Canadian companies, net of fees, increased 6.77% during the quarter and 43.81% over the past 12 months, outperforming the index by approximately 10% during the last 12 months. Over the past five and ten years, our Canadian holdings achieved annualized returns of 12.16% and 13.1%, respectively. Compared to the S&P/TSX, we underperformed by 2.19% annually over five years but outperformed by 1.35% annually over ten years.
Our significant allocation to precious metals royalty companies was the standout driver of this outperformance. These high-quality operators delivered exceptional results amid a strong rally in gold and silver prices, benefiting from rising geopolitical tensions, persistent inflation concerns, and robust physical demand. Their unique business model—providing capital to miners in exchange for royalties and streams—continues to generate attractive, low-risk cash flows with meaningful upside leverage to metal prices, all while requiring minimal direct exposure to operational risks. We remain highly confident in our core holdings and their durable long-term fundamentals, including strong balance sheets, proven management teams, and embedded growth options. As active managers, we stay disciplined in our approach: prioritizing capital preservation while remaining alert to attractive opportunities that can emerge rapidly during periods of market dislocation. As we move into Q2 2026, with stock markets hovering near all-time highs, we are mindful that valuations appear stretched and the environment may be vulnerable to a meaningful correction.
For the S&P/TSX Composite Index, 5 out of 11 GICS sectors delivered positive returns during Q1 2026. Here is the sector breakdown ranked from highest to lowest quarterly returns:
- Energy: +29.0%
- Materials: +10.4%
- Utilities: +10.2%
- Communication Services: +4.3%
- Consumer Staples: +2.8%
- Industrials: -0.5%
- Financials: -2.7%
- Consumer Discretionary: -4.4%
- Health Care: -5.0%
- Real Estate: -5.2%
- Information Technology: -22.5%
The quarter was characterized by a clear sector rotation toward commodity-linked areas amid elevated oil and metal prices, while growth-oriented sectors faced headwinds.
Energy led the market with a strong +29.0% return, driven by surging oil prices linked to geopolitical tensions in the Middle East and broader supply concerns, boosting Canadian producers and the sector’s significant weighting in the index.
Materials followed closely at +10.4%, supported by firm demand for metals including gold, silver, and copper, continuing momentum from prior years despite some intra-quarter volatility in precious metals prices.
Utilities (+10.2%), Communication Services (+4.3%), and Consumer Staples (+2.8%) also posted modest gains, acting as relatively defensive areas in an otherwise uneven environment.
On the downside, Information Technology was the weakest performer with a sharp -22.5% decline, reflecting concerns over AI disruption to software business models, valuation compression, and a broader rotation away from high-growth tech names.
Other laggards included Real Estate (-5.2%), Health Care (-5.0%), Consumer Discretionary (-4.4%), Financials (-2.7%), and Industrials (-0.5%), as investors favored traditional resource and defensive sectors over more rate-sensitive or cyclical areas.
US Equities
In the first quarter of 2026, our portfolio of U.S. and global companies declined by 3.9% net of expenses. This performance occurred against a challenging market backdrop, as major U.S. indices also posted negative returns amid heightened volatility. The S&P 500 (total return) fell approximately 4.33%, while the Dow Jones Industrial Average declined by roughly 3.6%. Several factors contributed to the broader market pullback, including a rotation away from high-valuation mega-cap technology and growth stocks (which had driven much of the prior years’ gains), concerns around the sustainability of AI-related capital spending, elevated oil prices linked to geopolitical tensions, and lingering economic uncertainties. Value-oriented and certain defensive sectors showed relative resilience, underscoring the benefits of a diversified, fundamentals-driven approach.
Despite the pullback in US markets during Q1, our portfolio continues to deliver attractive results over longer horizons:
- 5-year annualized return: 9.20%
- 10-year annualized return: 12.5%
These figures reflect the compounding power of owning high-quality businesses with strong fundamentals, above-average earnings growth potential, and reasonable valuations, the core of our investment philosophy. Over the past five years, our portfolio trailed the S&P 500 by about 2.9% annualized. Over the 10-year period, the underperformance narrowed to 1.7% annualized. However, we outperformed the Dow Jones Industrial Average by approximately 1.3% annualized over the same 10-year span. This pattern is consistent with our strategy: we focus on individual companies rather than the composition of the index. The S&P 500’s recent outperformance has been heavily concentrated in a handful of large growth names. When those leaders face headwinds—as they did in Q1—broader or more balanced portfolios (and indices like the DJIA) can demonstrate greater stability. Our holdings are selected for their ability to compound intrinsic value over time, not to mirror market-cap weighted indices.
For the S&P 500 Composite Index, 6 out of 11 GICS sectors delivered positive returns during Q1 2026. Here is the sector breakdown ranked from highest to lowest quarterly returns:
- Energy: +37.2%
- Materials: +9.3%
- Utilities: +7.5%
- Consumer Staples: +7.0%
- Industrials: +4.3%
- Real Estate: +1.9%
- Health Care: -5.3%
- Communication Services: -7.1%
- Consumer Discretionary: -9.3%
- Information Technology: -9.3%
- Financials: -9.8%
The S&P 500 (without re-invested dividends) posted a negative return of approximately -4.6% in Q1 2026, reflecting heightened volatility from geopolitical tensions, elevated energy prices, and a pronounced sector rotation away from high-valuation growth stocks toward value, defensive, and commodity-linked areas.
Only 6 of the 11 GICS sectors delivered positive returns, highlighting a broadening but uneven market environment.
Energy led the index by a wide margin with a +37.2% gain, driven primarily by escalating Middle East conflicts (including U.S./Israel involvement with Iran) that disrupted supply routes like the Strait of Hormuz, pushed crude oil prices well above $100 per barrel, and delivered strong cash flows, refining margins, and disciplined capital spending across upstream and midstream producers.
Materials followed at +9.3%, boosted by war-related commodity price spikes in chemicals, petrochemicals, and fertilizers (e.g., sharp rallies in companies like Dow and LyondellBasell), as supply disruptions lifted input costs and supported industrial gas and basic materials producers.
Utilities rose +7.5% as a defensive play amid uncertainty, further supported by surging electricity demand from AI data centers and power infrastructure needs.
Consumer Staples gained +7.0% on its classic safe-haven characteristics and stable domestic demand during the period of market stress and inflation fears.
Industrials added +4.3%, aided by capital spending on AI-related infrastructure, defense projects, and some reshoring/cyclical tailwinds, while Real Estate eked out a modest +1.9% increase in the defensive rotation.
On the downside, growth-heavy sectors faced sharp pressure from investor rotation, stretched valuations post the prior AI boom, and concerns over higher bond yields and energy-driven inflation. Information Technology and Consumer Discretionary both declined -9.3%, with mega-cap names (including AI leaders) hit by scrutiny over capex returns and reduced enthusiasm.
Financials fell the most at -9.8%, weighed by higher interest rates and macro uncertainty, while Communication Services dropped -7.1% and Health Care posted a milder -5.3% loss amid the broader shift away from prior leaders.
This Q1 performance underscores a significant market broadening, with energy’s outsized contribution cushioning the index. Expect a reversal in energy based on the end of war and hostilies in the Middle East.
Market Statistics
Pertinent market action during Q1 of 2026 and during the last 12 months is captured in the following table.
| Mar. 31, 2025 | Dec. 31, 2025 | Mar. 31, 2026 | 3 Month Return | 1 Year Return | |
| CAD/USD | $0.6951 | $0.7284 | $0.7190 | -1.29% | +3.44% |
| Oil WTI (US $) | $71.37 | $57.42 | $101.77 | +77.24% | +42.59% |
| Gold (US $) | $3,124 | $4,318 | $4,672 | +8.20% | +49.50% |
| Silver (US $) | $34.06 | $71.54 | $75.33 | +5.30% | +121.17% |
| S&P/TSX | 24,917 | 31,713 | 32,768 | +3.33% | +31.51% |
| S&P 500 | 5,612 | 6,845 | 6,529 | -4.62% | +16.34% |
| Cdn 10 yr. | 2.97% | 3.43% | 3.47% | +4 bps | +50 bps |
| US 10 yr. | 4.21% | 4.17% | 4.31% | +14 bps | +10 bps |
The following breakdown provides context for each financial metric as of March 31, 2026, highlighting the specific drivers behind the quarterly and annual returns.
Currencies & Interest Rates
- CAD/USD ($0.7190): Despite the surge in oil prices—a traditional tailwind—the Loonie fell 1.29% this quarter. This divergence is largely attributed to a “flight to safety” into the US Dollar amid escalating Middle East tensions and a growing yield gap between the two countries. It is important to point out that Canada, due to restrictive regulations imposed largely by the Federal government (Liberals and NDP), had a crippling lack of investment in the oil and gas sector over the past 11 years.
- CAD 10 yr. (3.47%): Canadian yields edged up 4 bps this quarter. While inflationary pressures from higher oil prices are high, domestic growth concerns, given increased regulation and taxation—highlighted by a 0.6% contraction in Q4 2025 GDP—have kept the Bank of Canada more cautious than the Federal Reserve.
- US 10 yr. (4.31%): US yields rose more aggressively (+14 bps) this quarter. Persistent US inflation and a “higher-for-longer” stance by the Federal Reserve, combined with safe-haven demand for Treasuries during geopolitical instability, have pushed yields to their highest levels since July 2025.
Commodities
- Oil WTI ($101.77): Oil was the quarter’s standout performer, jumping 77.24%. This massive “geopolitical risk premium” followed the effective closure of the Strait of Hormuz in late February 2026, which blocked roughly 20% of global supply.
- Gold ($4,672): Gold rose 8.20% this quarter, continuing a historic rally that saw it return nearly 50% over the past year. Demand is being driven by central bank diversification away from the USD and investors seeking a hedge against stagflation, war and escalating deficits and debt.
- Silver ($75.33): Silver has more than doubled (+121.17%) since last March. Beyond its safe-haven appeal, a five-year structural deficit and increasing demand from digitization, AI and data centres, solar panels, EV production and robotics have fundamentally repriced the metal. Expect much higher prices over the next 2-3 years.
Equity Markets
- S&P/TSX (32,768): The Canadian benchmark gained 3.33% this quarter. Its heavy weighting in Materials (+11.9%) and Energy allowed it to capitalize on the commodity boom, outperforming its US counterpart.
- S&P 500 (6,529): The S&P 500 suffered its worst quarter in four years, dropping 4.62%. The decline was driven by a sharp pullback in mega-cap tech stocks and fears that surging energy costs would act as a major drag on global consumer demand.
Overall takeaway
Q1 2026 was a year of dramatic divergence: precious metals (especially silver) staged historic rallies as hard assets and inflation hedges dominated, while energy lagged sharply. Equities performed well (with Canada outperforming the U.S.), the Canadian dollar firmed, and bond yields showed mixed but generally contained moves. The standout story remains the explosive bull market in gold and silver, which provided a powerful tailwind to resource-heavy Canadian indices amid broader global uncertainty.
C. ROCKLINC Investment Update
1. Private Client Assets- Separately Managed Accounts
Our ROCKLINC separately managed accounts delivered a 1.05% return in Q1 and a 18.76% return over the past year (ending March 31, 2026). More significantly, our average annual compound returns over the past 3, 5, and 10 years were approximately 11.9%, 7.7%, and 9.1%, respectively. These returns are net of fees and reflect an asset allocation of approximately 70% in equities, with the balance in short-term deposit accounts and short-term bonds. Please note that these figures represent aggregate performance across all accounts. Individual client portfolios may vary based on risk tolerance and specific asset allocations.
Our equity portfolio (comprising Canadian, U.S., and global equities) achieved an 2.7% return in Q1 and a 29.6% return over the past 12 months. Over the past 5 and 10 years, our equities have compounded at approximately 10.9% and 12.82% annually, respectively, aligning with major market indices. Our investment approach remains focused on the economic fundamentals of the businesses we own. We prioritize:
- Selectively adding companies identified through our research team’s analysis.
- Divesting underperforming businesses.
- Capitalizing on market volatility to increase positions at attractive prices.
With the launch of our new Rocklinc Principled Equity Fund ETF in November, we added a handful of new companies to our roster of businesses. Please see our brief writeup on our new ETF for a list of those new companies.
2. Rocklinc Partners Fund
Over the past four years, we have been utilizing the Partners Fund in more of the portfolios we manage. The Fund offers our clients a low cost and efficient way to purchase 16-20 strong businesses in one portfolio. It is an effective way to gain access to a global diversified portfolio with modest amounts of investment capital. Our number one objective is to create a Fund comprised of excellent companies that produce strong long-term performance.
Quarterly, we provide a performance update to our clients. Performance numbers are after all fees and rates of return beyond one year are annual compound rates of return.
Currently, the Fund is 11.8% in cash and short-term money market instruments, including 3 short-term corporate bonds (yielding 2.5 – 3%), 85.5% in publicly traded equities and 2.7% in two private equity investments. We expect our cash and bond weightings to remain in the 8%-12% range given market valuations and investment opportunities. We finished the quarter with $53 million in total assets.
During Q1, the only change to the Fund was the sale of our small position in Autodesk Inc., with the proceeds used to increase our holdings in Kelly Partners Group Holdings and Power Metallic Mines. Both companies are trading at less than half their estimated intrinsic values, offering significant upside that we wanted to capture.
After all expenses, the Rocklinc Partners Fund has been compounding at approximately 8.85% per year since inception (September 29, 2017) and by 13.60% and 8.30% over the past three and five years.
Over the past one and three years, the portfolio’s Canadian equities have compounded at 39.1% and 16.5%, while U.S. equities have compounded at 6% and 13.6%. Since inception in September 2017, Canadian equities have returned 12.7% annually, and U.S. equities have returned 11.1%. The Canadian holdings have outperformed the S&P TSX since inception. The U.S. holdings have underperformed the S&P 500 but have outperformed the DJIA and Russell 2000 since inception.
Our top 12 holdings represent approximately 75.1% of the total portfolio and 85% of the equity weighting in the portfolio. The top 12 holdings are Trisura Group (10.4%), Franco-Nevada Corp. (8.8%), Wheaton Precious Metals Corp. (8.6%), Markel Group (7.3%), Brookfield Corp. (6.5%), Gold Royalty Corp. (5.7%), Agnico-Eagle Mines Ltd (5.7%), Cameco Corp. (5.5%), Amazon.com Inc. (5.2%), API Group Corp. (4.5%), Kelly Partners Group Holdings Ltd. (3.6%) and Apple Inc. (3.3%).
As of March 31, 2026
| 3 mos. | 6 mos. | 1 yr. | 3 yr. | 5 yr. | Inception | |
| RL Partners** | 0.31% | 1.03% | 19.80% | 13.6% | 8.3% | 8.9% |
** Inception September 29, 2017 (NBN1212)
3. Rocklinc Kokomo Fund
In November 2022, we introduced the Rocklinc Kokomo Fund to offer our clients a regulated investment product registered outside Canada. The fund is domiciled in the Cayman Islands, a leading British Overseas Territory and the world’s premier offshore market for investment funds, with all assets securely held in custody in Grand Cayman.
The Rocklinc Kokomo Fund is supported by a robust team of professionals: FundBank serves as the Fund Custodian, SGGG Fund Services (Cayman) Inc. acts as the Fund Administrator, Carey Olsen provides legal counsel, and Grant Thornton (Cayman) is the Fund’s Auditor. The minimum investment is $100,000 USD, with the Net Asset Value (NAV) priced monthly, starting at $100.00 per unit. The portfolio is managed consistently with our discretionary accounts, comprising 15-20 stocks, low turnover, a competitive management fee, no performance fees, and monthly pricing and liquidity. Offering documents are available on our website or by contacting Rocklinc directly.
We began building the portfolio in February 2023 and continue to gradually add to our core positions. As of March 31, 2025, the Fund’s total value stood at approximately $9.3 million USD, with units closing the quarter at $124.70. The Fund delivered a strong return of 20.8% for the full year 2025.The Fund reached a new all-time high on February 28, 2025, at $140.17. However, heightened geopolitical tensions from the war in Iran, combined with a sharp pullback in precious metals and a significant decline in Burford Capital, led to a 6.4% decline in Q1, bringing the unit value down to $124.70 at quarter-end. At the time of writing, more than half of the March drawdown has already been recovered. Please note: All returns and performance figures are expressed in USD. Consistent client inflows have allowed us to selectively increase existing high-conviction positions, trim underperforming holdings, and introduce several promising new investments. Client interest remains robust, with new investors continuing to join the Fund on a regular basis. We believe there is a lot of upside to the existing portfolio!
As of March 31, 2025, the portfolio consists of 19 equity positions, representing approximately 81% of its total asset value. The remaining 19% is held in a money market fund yielding about 4.1% annually. Our target is to maintain 15–20 equity positions, with overall equity exposure in the 85–90% range, depending on attractive buying opportunities and current valuations. We have been gradually increasing equity holdings while preserving a prudent level of cash reserves. During Q1, there were no material changes in the portfolio.
The top 12 holdings by portfolio weighting are:
- Wheaton Precious Metals Corp.
- Trisura Group Ltd.
- Gold Royalty Corp.
- Brookfield Corp.
- OR Royalties Inc.
- Franco-Nevada Corp.
- Altius Minerals
- Markel Corp.
- Amazon Inc.
- Carlisle Co.
- Brookfield Infrastructure
- Roper Technologies Inc.
These positions represent approximately 64% of the total portfolio and 79% of the active equity weighting.
4. Rocklinc Principled Equity Fund ETF (TSX: RKLC)
On November 13, 2025, we launched the Rocklinc Principled Equity Fund (TSX: RKLC), an actively managed value-oriented ETF. The fund currently holds 16 equity positions, the vast majority of which are unique and feature minimal overlap with our flagship Rocklinc Partners Fund. This new fund is designed to offer clients enhanced diversification, strong capital protection, and lower overall volatility. As of March 31, 2026:
- Assets under management stood at $39.8 million up from $33.9 at the end of the year.
- The portfolio was allocated 16% to cash, with the remaining 85% invested across 16 equity positions. During the first quarter we sold our position in Danaher Corp and rolled it into our position in Royalty Pharma.
The 16 equity holdings, listed by their approximate weighting in the portfolio as of March 31, 2026, are:
- Sprott Inc.
- Royalty Pharma plc
- Agnico Eagle Mines
- Trisura Group
- OR Royalties
- Royal Gold Inc.
- Roper Technologies
- ServiceNow Inc.
- Brookfield Infrastructure
- Cameco Corp.
- MercadoLibre Inc.
- Kinsale Capital Group
- Prologis Inc.
- American Coastal Insurance
- Carlisle Companies Inc.
- Burford Capital Ltd.
During the first quarter of 2026, our concentrated equity portfolio delivered solid results amid a gold-driven rally in precious metals and continued strength in select high-quality compounders and specialty financials. The ETF was up 2.33% during the quarter.
The royalty and gold mining segment (Sprott Inc., Royalty Pharma, Agnico Eagle Mines, OR Royalties, Royal Gold) performed particularly well. Surging gold prices boosted assets under administration and inflows at Sprott, drove record quarterly royalty revenues at OR Royalties, and supported strong operational momentum and higher dividends at Agnico Eagle. Royalty Pharma reached new 52-week highs on resilient cash flows from its diversified biopharma royalty portfolio and continues to trade at a very attractive price.
Infrastructure, insurance, and industrial holdings (Brookfield Infrastructure, Trisura Group, Kinsale Capital, American Coastal Insurance, Carlisle Companies, Roper Technologies, Prologis) remained resilient. Specialty insurers benefited from disciplined underwriting in a favorable pricing environment, while quality compounders like Roper and Prologis traded at valuations that continue to offer attractive long-term margins of safety despite mixed broader market sentiment.
Technology and growth-oriented names (ServiceNow, MercadoLibre, Cameco, Burford Capital) showed varied performance. ServiceNow faced some valuation pressure amid AI-related concerns, but we view the business’s durable competitive advantages as intact at current levels. Cameco and Burford offer significant upside tied to secular tailwinds in energy transition and complex litigation finance where Burford continues to dominate, despite the inevitable volatility in the business model.
Overall, the portfolio’s emphasis on high-quality businesses purchased with a margin of safety—particularly those with royalty-like economics, strong balance sheets, and pricing power—positioned it well in a volatile quarter. We remain focused on intrinsic value, patient capital allocation, and avoiding overvalued speculative areas. No changes to our core conviction holdings as we enter the second quarter. Rocklinc Investment Partners continues to prioritize long-term compounding through disciplined value investing. For the most current details, including holdings, performance, and prospectus, please visit rocklinc.com or contact us directly.
D. Company Focus – Carlisle Companies Incorporated (CSL:US)
Death, Taxes, and Leaky Roofs
Benjamin Franklin spent 16 of his later years living in London, England. Two hundred and fifty years later, his home still stands. Not long after he left London, he famously wrote, “Nothing can be said to be certain, except death and taxes.” Since then, his house has weathered many storms, natural disasters, and two World Wars. While the frame of the house has remained intact, the certainty of decay has taken its toll on the roof many times over.
Carlisle Companies has built a wonderful business predicated on the certainty of decay. No matter what is inside a building, be it an office, a school, or a data centre, one thing is certain: nothing inside should get rained on. When a roof leaks, it does not matter what time of year it is, what the latest inflation numbers are, or what the latest Bank of Canada rate decision was; a roof needs to be repaired immediately, regardless of the cost. This makes the roof a “mission-critical” asset, ensuring non-discretionary demand for roofing manufacturers that is largely decoupled from broader macroeconomics.
Building owners, contractors, and architects alike turn to Carlisle to manufacture materials for the entire building envelope, the “skin” of the building that keeps heat in and rain out. As one of the few manufacturers in the United States that can install a complete system of roofing membranes, insulation, sealants, and vapor barriers, Carlisle is able to provide a full-coverage warranty that no small competitor can match. The typical 20- to 30-year full-coverage warranty creates a natural replacement cycle, as owners prioritize complete retrofits to secure a new long-term guaranteed warranty. Since Carlisle has been in business for over 100 years, building owners have peace of mind knowing the company will outlast the warranty. This warranty structure has prevented new entrants from gaining meaningful market share for over four decades. To enter this industry, a company needs a reputable brand name, a deep history, and enough capital to acquire an existing player. One of the few companies capable of meeting these requirements is Berkshire Hathaway, which purchased a large competitor in 2001.
Carlisle also aims to insulate its leading market share by creating a “lock-in” for roofing contractors. The roofing industry faces major labor shortages. Contractors are constantly training new employees, which slows building schedules and erodes margins. Consequently, contractors prefer to train on just one or two national brands that offer easy-to-install products. For a valid warranty, the contractor must be approved to install Carlisle products, and every product on the roof must come from Carlisle. Nearly half of Carlisle’s revenue stems from projects specifically designed for their products. For contractors, staying within the Carlisle ecosystem is not optional, it’s vital. This system lock-in creates a flywheel effect: more buildings and contractors enter the Carlisle ecosystem, driving further brand loyalty and creating a “sticky” revenue stream with high switching costs, a combination rarely seen in the construction industry.
Carlisle enjoys an annuity-like revenue stream as its vast ecosystem of U.S. buildings enters the replacement phase “like clockwork” at the end of each warranty cycle. Because modern energy standards have become significantly more stringent since these roofs were last installed, each replacement now requires a higher volume of material and more advanced technology per square foot. As the leader in labor-saving and energy-efficient systems, Carlisle provides building owners with a compelling ROI (return on investment) through lower installation costs and energy savings over the roof’s lifespan. This superior value proposition allows Carlisle to command premium pricing, cementing its position as the market’s high-end leader.
Prior to 2016, Carlisle was a conglomerate with five segments, manufacturing everything from brakes to cleaning and sanitation supplies for the commercial food-service industry. Upon his appointment in 2016, CEO Christian Koch immediately pivoted the company’s focus toward its high-value building products segment. Over a six-year span, he completed the transition into a pure-play building products company, divesting all other segments for total proceeds of $3.5 billion. That capital was used to strengthen the balance sheet, pursue accretive acquisitions, and repurchase 36% of the company’s shares over the last nine years. We believe the market is offering an attractive entry point, as it continues to apply a legacy conglomerate discount to Carlisle’s multiples, failing to recognize its successful transition into a pure-play building products manufacturer. With over 70% of the U.S. non-residential building stock exceeding 25 years of age, Carlisle is well positioned to accelerate growth and expand margins. This setup provides a long runway for the company to reinvest capital at high rates of return, further strengthening its economic flywheel. Two hundred and fifty years later, Benjamin Franklin’s London home remains a testament to the endurance of a well-protected structure. Carlisle has built a dominant enterprise on the relentless decay of the building envelope, monetizing Franklin’s own warning: “Beware of little expenses; a small leak will sink a great ship.”
E. Moving Forward
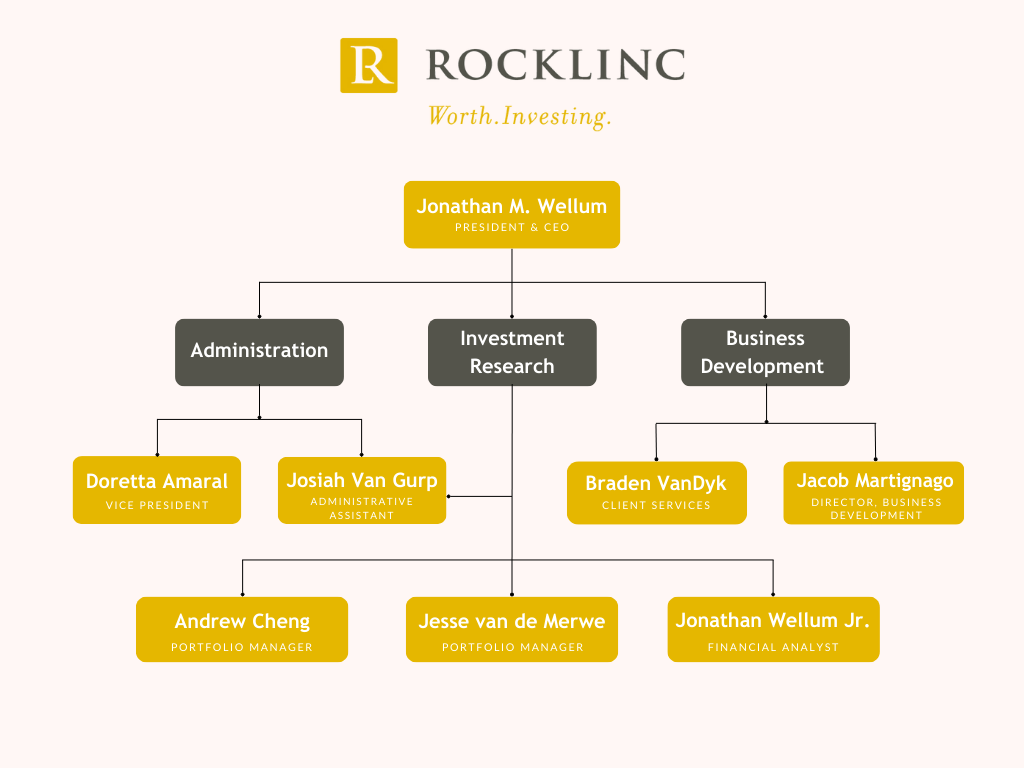
We continue to keep our eyes focused on the fundamentals of the businesses we invest in, within the context of a struggling global economy. We will do our best to take advantage of sharp moves in the market! We currently have eight full-time employees. Here is our organizational chart.
The investment team at Rocklinc is diligently managing our portfolio companies to meet or exceed expectations while seeking new opportunities to enhance your investments. Despite tariffs, trade tensions, or military activities, our core strategy remains unchanged: building portfolios of exceptional businesses. Below are ten key principles guiding our approach:
- Patience: We wait for attractively priced opportunities, leveraging our cash reserves to buy low during volatile periods. Tariff-related uncertainty, along with hostilities in the Middle-East and Europe may create short-term noise but also long-term opportunities. Quality companies at compelling valuations reward investors who focus on fundamentals, not headlines.
- Monitor Central Banks: Monetary policies, including repressed interest rates and increasing money supply, significantly influence market valuations. The policies being pursued by Central Banks are not supportive of strong currencies.
- Address Unsustainable Deficits: Government deficits pose risks to purchasing power. We maintain significant positions in precious metals and hard assets to mitigate these risks.
- Diversify Strategically: Our focused portfolios (25-30 securities) are diversified across asset classes, sectors, and regions to balance risk and opportunity.
- Prioritize Strong Balance Sheets: We invest in companies with tangible assets, robust financials, and minimal counterparty risk.
- Focus on Essential Industries: We target firms in growing sectors with long-term secular trends.
- Avoid High-Risk Firms: We minimize exposure to heavily leveraged financial companies with complex balance sheets, such as banks and insurers.
- Maintain Liquidity: Adequate cash reserves allow us to capitalize on market dislocations, earning 2.15% – 3.75% annually while preserving flexibility.
- Stay Opportunistic: We remain positive and proactive, grounded in realism and truth.
- Anchor in Faith: “Yes, my soul, find rest in God; my hope comes from him. Truly he is my rock and my salvation; he is my fortress, I will not be shaken.” Psalm 62:5-6 (NIV)
For questions about your account, please contact us to schedule an appointment.
ROCKLINC INVESTMENT PARTNERS INC.
Contact Information
ROCKLINC INVESTMENT PARTNERS INC.
4200 South Service Road, Suite 102
Burlington, Ontario
L7L 4X5
Tel: 905-631-LINC (5462)
www.rocklinc.com
| Doretta Amaral | damaral@rocklinc.com | (ext. 1) |
| Jonathan Wellum | jwellum@rocklinc.com | (ext. 2) |
| Jesse van de Merwe | jvandemerwe@rocklinc.com | (ext. 3) |
| Braden Van Dyk | bvandyk@rocklinc.com | (ext. 4) |
| Andrew Cheng | acheng@rocklinc.com | (ext. 5) |
| Jacob Martignago | jmartignago@rocklinc.com | (ext. 6) |
| Jonathan Wellum Jr. | jwellumjr@rocklinc.com | (ext. 7) |
| Josiah Van Gurp | jvangurp@rocklinc.com | (ext. 8) |
Disclaimer