A. North American Equity Market Statistics
Canadian Equities
During the fourth quarter, the Canadian equity market, as measured by the S&P/TSX total return index, increased by 3.5%. Year-over-year, the index increased 20.7%, including dividends. Our basket of Canadian companies (after all expenses) increased by 17% during 2024. Over the past 5 and 10 years, our Canadian businesses have compounded annually at 8% and 9%, respectively. When compared to the S&P/TSX we underperformed the index by 2% over the past 5 years, but over the last 10 years, we outperformed the index by 1.2%, compounded annually. Our weighting in the precious metals royalty companies, along with our weighting in infrastructure businesses, energy companies and several financial companies like Trisura Group and Brookfield Corporation have added value relative to the index. We continue to focus on the long-term economic fundamentals of the companies we own. We are pleased with our core positions and their favourable long-term fundamentals and continue to fine-tune our positions as opportunities arise.
In terms of the S&P/TSX index, four of the eleven sub-sectors generated positive returns during the fourth quarter. The returns of the sub-sectors from highest to lowest are: Consumer Discretionary (+14.1%), Communication Services (+8.6%), Financials (+6.7%), Information Technology (+4.7%), Industrials (-.7%), Energy (-3.2%), Consumer Staples (-3.8%), Utilities (-6.2%), Real Estate (-8.7%), Health Care (-10.7%) and Materials (-12.8%).
US Equities
During the fourth quarter of 2024, our portfolio of U.S.-based companies (after all expenses) increased by 7.5% and, over the past 5 and 10 years, compounded annually at 11.2% and 13.3%, respectively. During the quarter, we underperformed the S&P 500 index by approximately 1%. The challenge with the S&P 500 index is that it continues to be dominated by a handful (5 -7 companies) that have driven most of the returns on the index. We refuse to chase stocks and we will not buy stocks based on momentum. The basket of companies we own represent reasonable value and possess the characteristics to outperform the broader indexes in the coming years.
Over the past 5 years, we trailed the S&P 500 index by 3.2% and over the past 10 years we beat the index by .20% annually. When compared to the Dow Jones Industrial Average (DJIA), we outperformed the index by 6.9%, 2.9% and 4.2% over the past quarter, 5 and 10 years, respectively. If we look at the Russell 2000 which is a measure of smaller capitalization securities, we outperformed the index by 7.4%, 5.2% and 7.0% over the past quarter, 5 and 10 years, respectively.
Most recently, the returns in the U.S. markets have been influenced by a small number of businesses trading at high valuations and propelled by the excitement surrounding artificial intelligence (AI). There is no question that AI will have a significant impact on our economy but that does not give us license to chase overvalued securities and speculate on future returns. If we adhere to our long- term discipline, we will produce the consistent returns demanded by our investors.
Given the size of the U.S. market, most of the new holdings we have added to our portfolios over the past 2-3 years have been global businesses domiciled in the U.S. Expect us to add and substract 2-3 companies from our portfolios each year. In the fourth quarter, we added a small position in VOX Royalty Corp to our ROCKLINC Partners Fund. We expect this position to grow over the next few years.
Market Statistics
Pertinent market action during the fourth quarter of 2024 and during the last 12 months is captured in the following table.
| Dec. 31, 2023 | Sept. 30, 2024 | Dec. 31, 2024 | 3 Month Return | 1 Year Return | |
| CAD/USD | $0.7547 | $0.7392 | $0.6954 | -5.93% | -7.86% |
| Oil WTI (US $) | $71.29 | $68.20 | $71.72 | +5.16% | +0.60% |
| Gold (US $) | $2,063 | $2,634 | $2,624.50 | -0.36% | +27.21% |
| Silver (US $) | $23.79 | $31.11 | $28.90 | -7.10% | +21.48% |
| S&P/TSX | 20,958 | 24,000 | 24,728 | +3.03% | +17.99% |
| S&P 500 | 4,770 | 5,762 | 5,882 | +2.08% | +23.31% |
| Cdn 10 yr. | 3.10% | 2.96% | 3.22% | +26 bps | +10 bps |
| US 10 yr. | 3.88% | 3.78% | 4.57% | +79 bps | +69 bps |
During the fourth quarter, the Canadian dollar decreased by 5.9% against the USD and was down 7.9% over the last twelve months. Political uncertainty and horrific economic policies out of Ottawa has seriously damaged the Canadian economy. The wealth gap between Americans and Canadians has grown by over 40% since Justin Trudeau was elected as Prime Minister of Canada. This ongoing underperformance of the Canadian economy has dragged the Canadian dollar down relative to the USD. Given Canada’s weaker economy, the Bank of Canada has lowered interest rates in Canada at a faster pace than the US Federal Reserve, further weakening our dollar relative to the USD. Only a complete overhaul of our federal government, and the opening up of our resource sector to foreign capital, will restore our Canadian dollar back to .80 to .90 versus the USD.
Globally, the USD continues to be very strong and has advanced against every major currency in the world over the past few years. As we have pointed out in other reports, don’t confuse this with a strong dollar! The US fiscal situation is appalling with the US adding to its massive $36 trillion debt at a rate of over $2 trillion per year! The interest on their debt is now their largest discretionary line item at over $1 trillion per year. If the US dollar is strong, it is a good indicater of the feebleness of the major global currencies. With the recent election of pro-business, pro-investment, America- first President Donald Trump, we would expect the USD to remain strong relative to other currencies with the exception of gold which continues to power ahead despite the strong USD, indicating that all fiat currencies are losing ground to hard assets and in particular, gold.
During the quarter, gold was flat, but up 27% over the past twelve months. It finished the quarter at $2,625. Silver was down 7.1% during the fourth quarter and increased by 21.5% over the past year. We believe the long-term trends for both of these precious metals are to the upside and we continue to build positions in this sector. In fact, many of the precious metals mining companies and royalty businesses are undervalued relative to the price of gold and silver. Our major positions continue to be royalty companies Franco-Nevada, Gold Royalty Corp., Osisko Royalties, Royal Gold, Sandstorm Gold, Wheaton Precious Metals and leading miner Agnico Eagle Mines. We believe that these businesses are beautifully positioned to benefit from global turmoil, overindulgent governments and rising precious metals prices. Currently, they are trading at discounts to intrinsic value, with several trading at significant discounts.
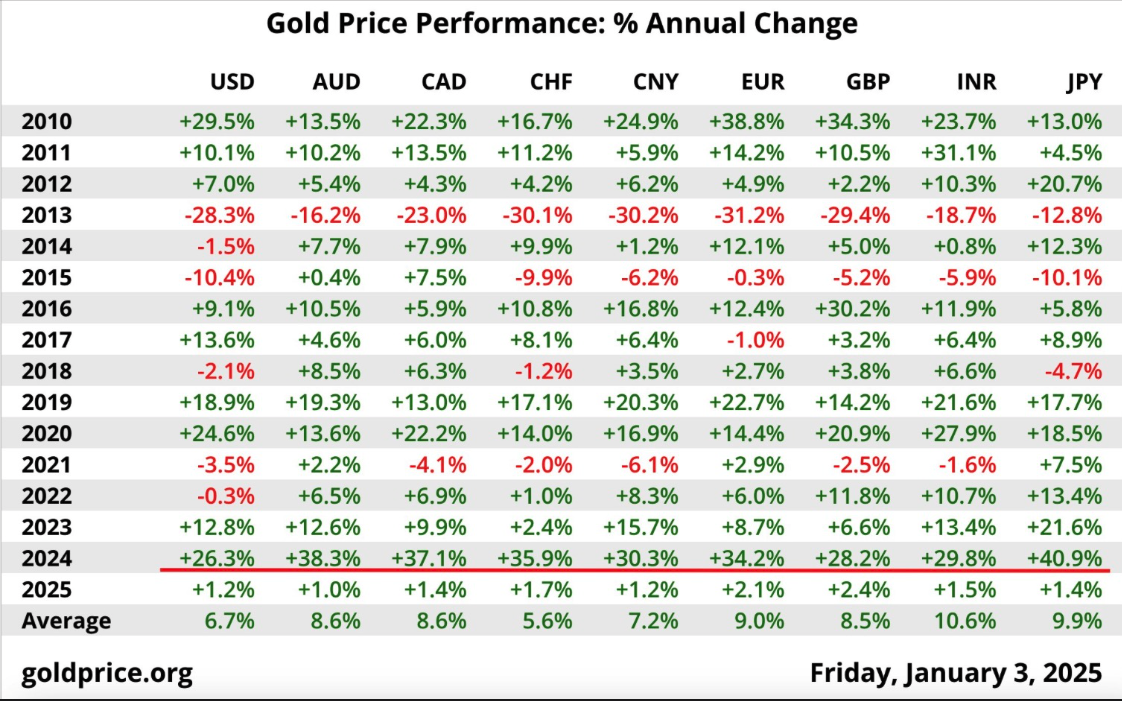
The chart below gives you a breakdown of the performance of gold bullion versus the major currencies in the world over the past 15 years. If you look at the third column and go down to the bottom you can see that gold averaged 8.6% per year in Canadian dollars. This is actually a much better barometer of inflation. Since gold is money and over long periods of time maintains purchasing power, you can see that in Canada, our dollar has been losing approximately 8% per year over the past 15 years. If you want to know why things are a lot more expensive than the government is telling you through their dishonest CPI (Consumer Price Index) calculations, then just look at how gold is performing over a 10-15 year period for a more accurate measure.
During the quarter, oil price increased by 5.2%, while year-over-year oil is up .60%. Currently, oil prices are averaging $70-$80 per barrel, which is very profitable for the industry and the companies we own in some of our portfolios. With the election of Donald Trump, we anticipate a significant increase in the exploration, development and production of oil and gas in the US. We believe this will keep a lid on the prices of oil and gas for the next few years. As a result, we will keep our direct exposure to the sector quite low. Currently, our direct investments in the oil and gas sector remain relatively small (less than 2% of our total assets). In our ROCKLINC Partners Fund, we currently own one oil company, MEG Energy Corp, at 1.5% of the Fund.
During the fourth quarter, interest rates climbed higher as inflation continued to be stubbornly high. The 10-year Canadian bond increased by 26 bps and the US 10-year treasury increased by 79 bps during the quarter. Year-over-year, the yields are now up by 10 bps and 69 bps on the 10-year Canadian and 10-year US bonds. With the reckless spending on the part of many governments continuing, including the Canadian and US governments, inflation is remaining intractably high. Normally, inflation would settle down with the largest rise in interest rates experienced over the past two years, but this assumes governments stop deficit spending at the outrageous levels we have observed over the past decade. But, will that actually happen? Will the new “Department of Government Efficiency” (DOGE) under the leadership of Elon Musk make any headway against an entrenched and corrupt State? We shall see! In the interim, we are not holding our breath! While we wait for financial prudence to return, we continue to keep our fixed income exposure short- term, liquid and only invested in the highest quality securities.
Many of our investors have asked us about how we manage currency risk. Our answer remains the same—the best way to minimize currency risk is to buy strong and growing businesses that generate revenue in numerous currencies and are backed by hard tangible assets. As a result, these businesses create a natural currency hedge in your portfolio and mitigate the impact of fluctuating currencies and inflation. Our view, which we have held for the past 15 years, is that all fiat currencies will continue to lose value against tangible or real assets. This is because governments around the world are fiscally irresponsible (run large budget deficits and accumulate large debts), and through their central banks, continue to print excessive amounts (through the whole business cycle) of money to support their indebted economies. The best proof of this is the gold chart on the previous page. Gold has advanced significantly against every major currency in the world reflecting the ongoing undermining of the value of all fiat currencies. The best performing currency over the past 15 years has been the Swiss Franc which gave up on average 5% per year against gold.
B. ROCKLINC Investment Update
Private Client Assets – Separately Managed Accounts
In terms of our ROCKLINC separately managed accounts, they increased by 2.3% during the fourth quarter, and by 14.2% during the last year (period ending December 31, 2024). More importantly, our average annual compound rate of return over the past 3, 5 and 10 years is clocking in at approximately 4%, 7% and 7.6%, respectively. Returns are after all fees, and are based on an asset mix of approximately 67% invested in equities, with the remainder invested in short-term deposit accounts and short-term bonds. Please note that the performance we are disclosing is our aggregate performance across all our accounts. Each client’s portfolio is unique and performance will vary, based on your risk tolerance and your specific asset allocation.
When we dig further into our numbers, we find that our basket of equities (Canadian and U.S.) were up by approximately 3% during the fourth quarter and up by approximately 19% during the past 12 months. Our equities have been compounding by approximately 9.1% over the past 5 years and by 10.5% over the past 10 years, keeping pace with the major indexes.
We continue to focus on the economic fundamentals of the businesses we own. This means that we first, selectively add companies as our research team ferrets out new opportunities. Second, prune underperforming businesses. Third, take advantage of market swings and add to existing positions at better prices!
During the year, we started to build new positions in APi Group (see write-up in first quarter report), Brookfield Corporation, Burford Capital (see write-up in third quarter report), Cameco, Markel Group (see write-up later in the report) and VOX Royalty. We also added significantly to Amazon, Trisura, Schneider Electric and several of our precious metals royalty companies. We trimmed positions in Church & Dwight, Suncor Energy and eliminated our positions in American Tower, TD Bank, Telus and BCE Inc. We have also lightened our exposure to two REITS. Throughout 2024, we have been very active in working to ensure we are invested in the best businesses we can ferret out. That means we are looking for businesses that are growing quickly, have strong balance sheets and are trading at attractive prices.
ROCKLINC Partners Fund
Over the past three years, we have been utilizing the Partners Fund in more of the portfolios we manage. The Fund offers our clients a low cost and efficient way to purchase our top 20-25 companies in one portfolio. It is an effective way to gain access to a global diversified portfolio with modest amounts of investment capital. Our number one objective is to create a Fund comprised of excellent companies that produce strong long-term performance.
Quarterly, we provide a performance update to our clients. Performance numbers are after all fees and rates of return beyond one year are annual compound rates of return. Currently, the Fund is 30% in cash and short-term money market instruments (yielding 3 – 4.5%), 69% in publicly traded equities and 1.0% in one private equity investment. We expect our cash weighting to slowly come down thoughout the first quarter of 2025. We finished the year with $46 million in total assets in the Fund up from $13.7 million at the beginning of the year.
We were very active throughout 2024 in the portfolio. During the year we eliminated eleven companies, and added nine new positions. We sold our entire positions in Alphabet (Google), American Tower, Brookfield Infrastructure LP, Brookfield Renewable LP, Church & Dwight, CoStar Group, Glencore PLC, Intercontinental Exchange Inc., Linde PLC, Suncor Energy and TD Bank. In the case of the two Brookfield companies we decided to move the capital from these two businesses and invest the proceeds in Brookfield Corporation, the parent company. We now have approximately 9% of the Fund invested in Brookfield Corporation which trades at an attractive price and gives us exposure to all of the Brookfield businesses. The other eight new positions we added throughout 2024 were Agnico-Eagle, API Group, Burford Capital, Cameco, Gastronomous Technologies, Markel Group, Schneider Electric, and Vox Royalty.
As new money flows into the fund we will add to existing positions based on the valuations of the companies in the portfolio.
After all expenses, the ROCKLINC Partners Fund has been compounding at approximately 7.6% per year since inception (seven years) and 7.1% over the past five years.
When you look through to the equities in the portfolio, the Canadian stocks have been compounding at 9% and the U.S. equities have been compounding at 11.25% over the past five years. During the same five-year period, the S&P/TSX total return index compounded at 10.0%, the S&P 500 compounded at 14.5% and the Dow Jones Industrial Average at 9.0%.
Our top 12 holdings represent approximately 54% of the total portfolio and 77% of the equity weighting in the portfolio. The top 12 holdings are Brookfield Corporation (8.9%), Trisura Group (8.1%), Amazon (5.7%), Markel Group (5.0%), Roper Technologies (3.8%), Apple Inc. (3.6%), Franco- Nevada (3.6%), Burford Capital (3.6%), Wheaton Precious Metals (3.4%), Autodesk (2.9%), Schneider Electric (2.7%), and Danaher Corp. (2.6%).
As at December 31, 2024
| 3 mos. | 6 mos. | 1 yr. | 3 yr. | 5 yr. | Inception* | |
| RL Partners | 4.7% | 8.6% | 17.4% | 4.1% | 7.1% | 7.6% |
ROCKLINC Kokomo Fund
In November 2022, we launched our ROCKLINC Kokomo Fund in order to assist some of our clients and provide them with an investment product that is regulated and registered outside of Canada. Our Kokomo Fund is registered in the Cayman Islands and all funds are held in custody in Grand Cayman. It is important to point out that the Cayman Islands are a British Overseas Territory and the world’s number one offshore market for investment funds.
The Fund Custodian for the ROCKLINC Kokomo Fund is FundBank, the Fund Administrator is SGGG Fund Services (Cayman) Inc., the Fund’s legal counsel is Carey Olsen, and Fund’s Auditor is Grant Thornton (Cayman). The minimum investment is $100,000 USD. The Net Asset Value (NAV) of the Fund is priced monthly and started at $100.00 per unit. We are managing the portfolio in a similar manner to how we manage all our discretionary accounts. This will include 20-25 stocks, low turnover, a competitive management fee, no performance fees and monthly pricing and liquidity. Offering documents are available on our website or by calling us at ROCKLINC.
We started making investments in the portfolio in February 2023 and continue to add slowly to our core positions. As at December 31, 2024, the Fund had a total value of approximately $6.8 million USD. The units closed at $108.76. There has been a consistent flow of money into the Fund providing us with opportunities to add to our existing positions, trim underperforming businesses, and add new positions to the portfolio. Client interest is strong and we are continuing to add new clients into the portfolio on a regular basis.
As of December 31, 2024, we have 18 equity positions in the portfolio representing approximately 76% of the total value of the assets. The remaining 24% is invested in a money market fund currently earning approximately 4.5% per year. Our objective is to keep the number of equities in the portfolio around 20 and not more than 25, and increase the equity weighting up to 85-90% based on buying opportunities and valuations. We are patiently adding to our equity weights, while keeping cash on the sidelines.
We were very active in the portfolio throughout 2024. In total, we eliminated seven positions and added six new businesses to the portfolio. We sold the following companies; American Tower, Brookfield Renewable, CoStar Group, Glencore PLC, Intercontinental Exchange Inc., Linde PLC and Suncor Energy. We added to the portfolio, API Group, Brookfield Corporation, Burford Capital, Gold Royalty Corporation, Markel Group and Schneider Electric. Our companies are well positioned to grow and add substantial value to the Fund over the next few years.
Our top 10 companies in the portfolio by portfolio weighting are Trisura Group Ltd, Brookfield Corporation, Markel Group, Burford Capital, Wheaton Precious Metals, Amazon, Roper Technologies, Osisko Royalties, Apple Inc., and AutoDesk Inc. These businesses represent approximately 54% of the total portfolio and 71% of the active equity weighting in the portfolio.
C. Company Update – Markel Group (MKL)
Tom looked at his watch. If time could go backwards, it certainly would happen here. Working away at a public accounting firm, the days filled with audits, annual returns and paper-shuffling were monotonous and seemed endless. He was more interested in dollars than the numbers, as he would like to say; his mind was on other things than accounting. He was more interested in investing, strategy and business-building – it was the eighties after all. He had read in Fortune magazine about this investor out of Omaha, Nebraska named Warren Buffett, who had built himself a resilient capital compounding machine. Away from the typical financial bedlam of New York and from the quiet, middle-class New Jersey life he grew up in, Tom Gayner saw Buffett constructing the world’s best value creation machine in Berkshire Hathaway, built upon the ‘float’ of insurance. Buffett could take the excess underwriting profits from the insurance operations and invest those proceeds at high rates of return in the equity market. The returns were consistent and, over time as the result of compounding, astonishing.
Fast forward two years and Tom jumped ship from the stale world of accounting to enter the lively world of investment banking. In 1986, he found himself at Davenport & Company, a small mergers & acquisitions outfit based in Virginia. Time stopped going backwards. He was assigned to cover banks and insurance companies and shortly after arriving at Davenport, he was assigned a small insurance company named Markel, based not far away in Richmond, Virginia. It was an extraordinary time to be covering financial businesses, with the benchmark interest rate in the U.S rapidly approaching double-digit levels. High inflation was raging and most insurance companies weren’t generating profitable underwriting results, relying on high interest rates to generate enough income to boost the overall profitability of the organization. Markel was different. It was able to churn out both stellar investment returns and underwriting profitability. What, or who, was this company and how did they do it?
In the depths of the Great Depression, a bold Samuel Markel founded a small insurance outfit geared towards servicing the growing bus and trucking industries. The mighty automobile was quickly ingratiating itself into the American way of life at the turn of the century and so too was the subsequent logistics and transportation industries. Markel was making a name for itself – Samuel’s four sons joined the business and influence and growth followed. So active was the firm in the efforts of developing safety and service standards for the transportation industry that it provided input to Congress in the formation of the National Motor Carrier Act of 1935. It would be the evolution from focusing solely on motor vehicle insurance to broadening out to specialty lines of insurance that would propel Markel into its next phase of growth. Specialty lines of insurance are those that are harder to underwrite but tend to have wider margins and increased customer stickiness. In a commoditized world, Markel was sharpening its competitive advantage.
Staring at him on his desk was Markel’s initial public offering documents, with an offering price of $8.33 and a market capitalization of $32 million—a far cry from today’s share price of $1,750 and market capitalization of $22 billion. The Fortune magazine article from a couple years prior popped into Tom’s mind; his admiration for Buffett, the power of compounding and the world of insurance was an irresistible draw for him. He would last a few more years at Davenport but by 1990, he was working at Markel. An outsider in a firm that had been family-run for three generations, Gayner’s affable character and financial acumen saw him quickly rise to the upper ranks of management. The firm he was assigned to cover in his first year as a young associate would become the firm that he would run as its chief executive in the years to come.
Insurance may seem like an odd choice for someone bored with the monotony of accounting and spreadsheets and looking for a change. However, as Gayner correctly ascertained, it is an area that can be very exciting. An insurance executive needs to make a number of crucial decisions, founded upon risk tolerances, circles of competence and informed opinions on economics, society and geopolitics. Firstly, an insurance company must determine the type of risks it wishes to underwrite. These risks can be straightforward (ie. car insurance) or complicated (ie. insuring a chemical plant’s operational liabilities). Markel focuses on the latter type, known in industry parlance as ‘specialty’ or ‘excess and surplus’ lines of insurance. Risks in these areas are more ‘hard to place’, where premiums are not regulated and insurance companies do not compete solely based on price but rather on availability, service and expertise. Specialty insurance affords the ability to create competitive advantages, defensible ‘moats’ and ultimately, recurring profits. Secondly, an insurance company must make investment decisions regarding excess capital on its balance sheet. This capital may be invested into areas such stocks and bonds. Investment returns may comprise the majority of net income in a year for an insurance company and therefore is just as important as underwriting profitability. Gayner saw an opportunity to oversee an entity similar to what Warren Buffett had masterfully crafted with Berkshire Hathaway – a strong insurance operation built upon consistent underwriting profitability, with excess profits compounded into other businesses.
Insurance
Markel is the third largest excess and surplus underwriter in the U.S, as measured by direct premiums written. The assets and industries the Company has exposure to in its insurance lines is vast – from general commercial liability to personal lines and everything in between, on operations that spans industries including construction, energy, life sciences, professional services, healthcare, shipping and more. Markel insures everything from classic cars to container ships, fine art to workers’ compensation programs, weather events to professional liability coverage—there’s not much of the global economy Markel doesn’t touch. Historically speaking, the Company’s combined ratio (an industry metric where a number below 100 measures the degree of profitability) has historically trended in the low-90 percent range; an envious position. In the past year, strong areas of outperformance for Markel include its surety business, personal lines, management liability protection and environmental liability coverages. In the rare instances of miscalculating risk, management is quick to admit to mistakes and retreat from underwriting those exposures. For example, Markel ventured into the new area of collateralized intellectual property insurance, which did not perform to expectations. After realizing the initial product was not designed well as the share of risks between Markel and the buyers did not match up appropriately, the Company was quick to cut exposure and go back to the drawing board. Humble management that is quick to alter course if required is exactly the type of leadership you want running a global insurance operation. Markel remains an industry-leader in conservatively estimating its potential loss reserve (ie. required cash to have on hand given a probable future claim), resulting in a predictable bulwark with few surprises. It is no surprise that Markel has historically maintain peer-leading combined ratios and book value per share growth.
Investments
A shrewd investor from a young age, having cut his teeth in investing from gathering stock tips from his grandmother, Gayner joined the Markel in 1990 to aid its investments operations. Today, the Company stands out amongst its peers for being heavily tilted towards creating value from its investment ‘float’ (ie. excess capital on its balance sheet). The results have been outstanding. Under Gayner’s leadership, the $10 billion investment portfolio has outperformed the S&P by approximately 3% per year over the past 10 years. At other moments in time, it’s been even higher— in 2015, his 15-year compound annual growth rate was 7% higher than the index. Gayner runs a concentrated portfolio of businesses, with his top ten holdings accounting for over 40% of the portfolio value. Markel’s investment philosophy aligns with ROCKLINC’s own investment criteria for solid businesses:
- Good returns on capital without using too much leverage
- Amble reinvestment opportunities and capital discipline
- Management teams with equal measures of talent and integrity
- Pay a fair price for the business
In keeping with their value investing philosophy, the Markel management team can often be spotted at the Berkshire Hathaway annual meeting. Besides being personal friends with Buffett and sharing a mutual love of Coca-Cola, Gayner has other credentials to be present—Markel owns over $1.2 billion in Berkshire Hathaway stock.
Markel Ventures
In 2005, Markel purchased its first private business, AMF Bakery Systems, an industrial bakery equipment producer. A purchase of a private business with an insurance company’s float is exceptionally rare and sets Markel apart from the industry. Undeterred, the Company would go on to devote more capital to the purchase of more companies in the coming years, accumulating a variety of private businesses to what is known as today as Markel Ventures. Since inception, Markel has invested $3.7 billion into various businesses, ranging from manufactured home producers to ornamental plant nurseries and crane rental providers, among others. Since 2005, Markel has collected over $1.9 billion in dividends and currently the portfolio produces $628 million in EBITDA (a metric of profitability) on $5 billion in revenue. Markel Ventures is an opportunistic way to deploy capital in high-return companies, avoiding the insurance industry temptation of chasing premium growth when times are good—in effect, Markel Ventures instils disciplined growth across the organization. This ‘multi-engine’ (insurance, investments, Markel Ventures) system allows for resilience and durability, without dependence on any individual engine to provide growth for the overall company.
As we allocate your capital prudently, seeking to invest in businesses with high returns on capital and letting consistent compounding take hold, we look to stand on the shoulders of those who are managing businesses whose objectives are the same. According to Markel, and in order of priority, capital will be used to fund internal organic growth opportunities, acquire controlling interests in businesses at fair prices, build a portfolio of equity securities and repurchase shares. As an insurance company, Markel is providing the grease of the global economy, underwriting prudent risks as it hones its competitive edge in various corners of the market and subsequently allocating those insurance profits into its currently highest returning opportunity. That compounding flywheel has manifested itself through Markel’s financial results. In the past 10 years, the Company has grown its earnings per share at a compound annual growth rate of 21% and its book value per share at a compound annual growth rate of 18%. In 2025, earnings per share is forecasted to grow double- digits. And yet, despite these consistent results, the price you pay today for Markel’s earnings is hovering at 15-year lows. To pay for one year of Markel’s earnings today, you would have to shell out 18x earnings—a steal compared to the Company’s 10-year median price to earnings multiple of nearly 28x. The valuation looks even more rosier when comparing Markel to its peers in the marketplace when examining the price to book value. Coming in at a hair under 1.4x book value coupled with a Return on Equity over 18%, the median price to pay for book value of competitors jumps to over 2.0x with similar returns on equity.
We have taken advantage of this apparent market irrationality and used the opportunity to purchase shares in this fantastic business.
D. Moving Forward
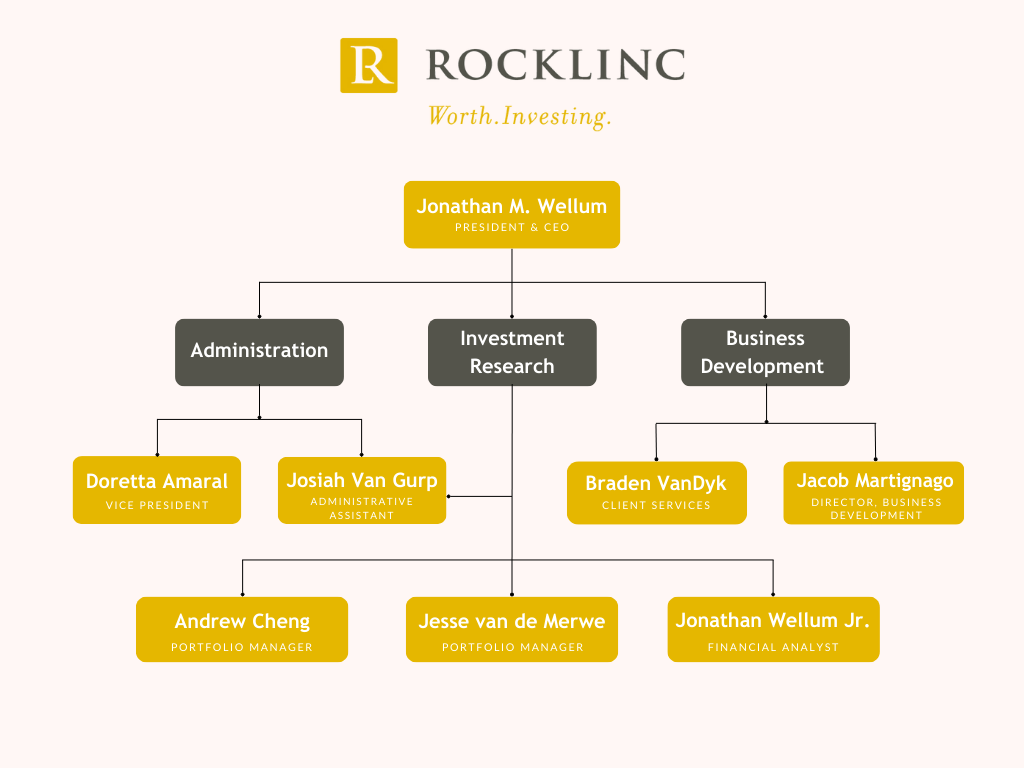
We continue to keep our eyes focused on the fundamentals of the businesses we invest in, within the context of a struggling global economy. We will do our best to take advantage of sharp moves in the market! During 2024 we added another full-time employee to our team, Josiah Van Gurp. Josiah is splitting his time between administration and investment research. We now have eight full-time employees. Here is our organizational chart.
The investment team at ROCKLINC is working hard to make sure our existing companies are performing as expected or better and searching for new companies that we can add to your portfolios. During 2024, we were more active than normal adding nine new businesses to our portfolios and eliminating more than eleven positions.
Within the current environment our basic strategy is as follows:
- Patience – we need to wait for well-priced opportunities. Our patience and cash positions give us the flexibility to buy low. Markets continue to trade at very high valuations
- Watch the world’s leading Central Banks. Interest rates have come down but will probably stay higher for longer while inflation remains elevated. In fact, we may even see a small rate hike this year!
- Governments continue to run massive deficits that are not sustainable. This means out purchasing power will remain under pressure and standards of living will continue to drop. At some point, deficits and debts will matter and we want to be protected as much as possible from this risk. As a result, we continue to own significant positions in precious metals.
- Diversify across asset classed, sectors and geographic regions. While we run focused portfolios (20-30 securities), we are also careful to maintain an appropriate level of diversification.
- Invest in businesses with strong balance sheets, backed by hard and tangible assets with limited counterparty risk.
- Invest in firms that produce essential products and services, in growing industries, with well-established long-term secular growth trends. Our highlighted company this quarter Markel Corp is an excellent example.
- Avoid/minimize highly leveraged financialized firms that have incomprehensible balance sheets, loaded with risky derivatives. We continue to minimize our exposure to banks and life insurance companies!
- Maintain adequate liquidity in our portfolios, in order to take advantage of significant moves in the stock market. Cash is not trash when the markets become irrational! Our cash investments are earning approximately 4.00% per year.
- Remain positive and opportunistic, seasoned with a dose of reality and rooted in truth.
- Place your faith and hope in God. As the prophet Jeremiah reminds us, “God! It is you who have made the heavens and the earth by your great power and by your outstretched arm! Nothing is too hard for you.” (Jeremiah 32:17)
If you have any questions pertaining to your account, please call or email for an appointment.
ROCKLINC INVESTMENT PARTNERS INC.
Contact Information
ROCKLINC INVESTMENT PARTNERS INC.
4200 South Service Road, Suite 102
Burlington, Ontario
L7L 4X5
Tel: 905-631-LINC (5462)
www.rocklinc.com
| Doretta Amaral | damaral@rocklinc.com | (ext. 1) |
| Jonathan Wellum | jwellum@rocklinc.com | (ext. 2) |
| Jesse van de Merwe | jvandemerwe@rocklinc.com | (ext. 3) |
| Braden Van Dyk | bvandyk@rocklinc.com | (ext. 4) |
| Andrew Cheng | acheng@rocklinc.com | (ext. 5) |
| Jacob Martignago | jmartignago@rocklinc.com | (ext. 6) |
| Jonathan Wellum Jr. | jwellumjr@rocklinc.com | (ext. 7) |
| Josiah Van Gurp | jvangurp@rocklinc.com | (ext. 8) |
Disclaimer