A. Rocklinc Investment Thesis – Strategic Positioning
Many of our investors have asked how we navigate current market conditions and prepare for sweeping global changes. We believe the 2026 – 2030 and beyond market landscape is defined by six powerful, interconnected macro trends: digitization, debt, debasement of fiat currencies, de-globalization, demographics, and dear valuations in growth areas. These “six D’s” present distinct risks and opportunities. This introduction to our second quarter report outlines our investment strategy across six targeted sectors populated with high-conviction and well researched companies:
- Technology: Driving innovation amid rapid digitization.
- Commodities: Focusing on precious metals and critical minerals.
- Infrastructure: Capitalizing on structural and de-globalization shifts.
- Finance: Targeting insurance and alternative assets.
- Industrial: Supporting supply chain resilience and essential businesses.
- Other: Capturing specialized value through biopharma royalties.
Our portfolios are strategically engineered for resilience and upside growth at reasonable prices.
1. Digitization (AI, Data Centres, Robotics, EV, Automation)
Rapid adoption of artificial intelligence (AI), cloud computing, electrification, and automation isdriving exponential demand for computing power, energy, connectivity, and efficiency tools.
- Technology sector directly powers the trend: Amazon via AWS cloud and data-centre infrastructure; Apple through hardware ecosystem, services, and potential robotics/EV extensions; ServiceNow with AI-driven enterprise workflow automation; MercadoLibre expanding digital commerce and fintech platforms in high-growth regions; Roper Technologies providing mission-critical vertical-market software that boosts operational productivity.
- Infrastructure sector supplies the physical backbone: Brookfield Corp and its units Brookfield Infrastructure LP and Brookfield Renewable LP are aggressively investing in hyperscale data centres and power infrastructure (multi-billion-dollar AI power programs). TC Energy, Enbridge, and Capital Power deliver reliable energy transmission and generation to support the economy and increased data-centre loads.
- Industrial sector enables the hardware layer: Schneider Electric leads in power management, cooling, automation, and electrification solutions tailored for AI data centres (Nvidia partnerships). Rolls-Royce advances small modular reactors (SMRs) and power systems for reliable, high-density energy needs. Carlisle Companies supplies energy-efficient building materials and insulation critical for data-centre construction. Prologis provides logistics warehouses that support e-commerce and just-in-time supply chains accelerated by digitization.
- Commodities sector provides the raw materials: Copper (via Power Metallic Mines and Altius Minerals – royalties) is essential for data-centre wiring, EV batteries, and electrification; Uranium (Cameco Corp.) offers baseload nuclear power for always-on data centres; PGEs (platinum-group elements via Power Metallic) support catalytic and battery technologies in EVs and robotics.
- Finance sector indirectly benefits via higher asset values and insurance demand tied to tech-driven economic growth.
2. Debt (Global sovereign and total debt at unprecedented ~$353 trillion / ~310% of GDP – still rising)
Record debt levels force governments and corporations toward higher spending, inflation tolerance, and fiscal stimulus, while creating interest-rate and refinancing risks.
- Infrastructure sector is a prime beneficiary: Brookfield Corp, Brookfield Infrastructure, Brookfield Renewable, TC Energy, Enbridge, and Capital Power participate in large-scale public-private infrastructure projects funded by government stimulus and private capital seeking inflation-protected, long-duration cash flows.
- Finance sector thrives in a higher-rate environment: Specialty insurers (Markel, Trisura, American Coastal, Kinsale Capital) generate stronger investment income on float and maintain disciplined underwriting in a hardening market. Current valuations are close to historic lows given the soft market. This is the optimal time to build positions in these exceptional companies. Sprott Inc. and Burford Capital offer alternative asset exposure less correlated to traditional debt markets. Sprott is a play on the total commodity complex as the leader in commodity ETFs.
- Commodities sector (especially gold/silver royalties) acts as a hedge against debt monetization and potential crowding-out effects.
- Industrial & Technology sectors gain from productivity tools that help offset the growth drag of high debt burdens.
3. Debasement of Fiat Currencies (pressure on USD, Euro, Yen, Pound)
Persistent deficits and monetary expansion erode purchasing power of major currencies, driving demand for scarce, non-fiat assets.
- Commodities sector is the clearest hedge: Franco-Nevada, Wheaton Precious Metals, Agnico-Eagle, Royal Gold, Vox Royalty, Gold Royalty Company, and Altius Minerals provide low-cost, leveraged exposure to gold and silver through royalty/streaming structures (no mine-operating risk). Cameco (uranium) and Power Metallic (copper + PGE + precious metals by-products) add critical-mineral diversification.
- Infrastructure sector offers inflation-linked real assets: Brookfield entities, pipelines (TC Energy, Enbridge), and utilities (Capital Power) typically feature escalators or regulated returns that protect against currency debasement.
- Industrial sector real-estate and hard-asset components (Prologis warehouses, Carlisle building products) serve as tangible stores of value.
- Finance sector alternatives (Burford litigation finance, Sprott precious-metals funds) and specialty insurance float benefit from higher nominal yields.
4. De-globalization (reshoring, nearshoring, trade barriers, supply-chain re-alignment)
Tariffs, geopolitical tensions, and national-security priorities are shortening and regionalizing supply chains.
- Industrial sector is ideally positioned: Prologis benefits directly from nearshoring-driven warehouse demand in North America and Europe. Carlisle Companies and Schneider Electric support regional manufacturing and automation. Rolls-Royce provides domestic aerospace, defense, and power solutions.
- Technology sector gains via regional digital platforms: MercadoLibre dominates Latin-American e-commerce and fintech, reducing reliance on global giants.
- Infrastructure sector supports energy independence and localized infrastructure: Enbridge, TC Energy, Capital Power, and Brookfield assets enhance regional energy security.
- Commodities sector favors domestic or allied-jurisdiction production: Canadian-focused royalty companies (Franco-Nevada, Wheaton, Altius, Power Metallic, Cameco) and miners (Agnico-Eagle) reduce exposure to concentrated foreign supply risks.
5. Devastating Demographics (aging populations requiring massive productivity gains)
Developed-world demographics are worsening; labor-force shrinkage demands productivity offsets and healthcare solutions.
- Technology and Industrial sectors deliver productivity tools: AI/automation from Amazon, ServiceNow, Roper, Schneider Electric, and Rolls-Royce robotics/power systems directly address labour shortages. Prologis and Carlisle support efficient logistics and construction.
- Other sector (Royalty Pharma) captures long-term healthcare demand: biopharma royalty streams on innovative drugs treat age-related diseases, offering durable, high-margin cash flows uncorrelated to cyclical markets.
- Infrastructure sector indirectly supports via healthcare and senior-living facilities (Brookfield real-estate exposure) and reliable power for medical tech.
- Finance sector specialty insurers underwrite longevity and healthcare-related risks.
6. Dear Valuations (elevated stock-market multiples, especially AI-driven mega-caps)
US equity valuations remain stretched (CAPE (Cyclically-Adjusted Price-to Earnings) ratios in the mid-to-high 30s); passive/index flows concentrate in a narrow set of names, leaving value in less-followed areas that will outperform the market in the next 3-5 years when valuations adjust back to reality.
- Commodities sector royalties/streamers (Franco-Nevada, Wheaton, Agnico-Eagle, Royal Gold, Vox, Gold Royalty, Altius) and explorers (Power Metallic) trade at discounts to underlying metal prices with lower operational risk.
- Finance sector offers uncorrelated alpha: specialty insurers (Kinsale, American Coastal Insurance Company, Trisura, Markel) and alternatives (Burford Capital – litigation finance, Sprott asset manager with physical precious-metals trusts) are overlooked by passive investors.
- Infrastructure and Industrial sectors contain inflation-protected, cash-flowing real assets (Brookfield, pipelines, Prologis, Carlisle, Schneider) that screen cheaper on free-cash-flow or EBITDA multiples.
- Other sector (Royalty Pharma) provides high-quality, royalty-based pharma exposure at reasonable valuations versus high-growth tech.
- Technology sector is selectively used: investing a couple big names, Apple and Amazon that trade at reasonable valuations, given their prospects along with several that do not carry a premium multiple, MercadoLibre, Roper, ServiceNow that all offer growth-at-reasonable-price in non-mega-cap digital plays.
Conclusion and Portfolio Implications
This six-sector allocation builds a resilient, theme-driven portfolio that performs across any economic outcome. It balances growth from digitization and demographics, hedges against debt, debasement, and de-globalization, and value opportunities from attractive valuations, all while spreading risk across regions and asset classes.
Royalty structures in commodities and pharma reduce downside exposure. Infrastructure and industrial holdings deliver inflation protection and real assets. Specialty finance adds uncorrelated returns, while targeted technology captures powerful productivity gains.
The strategy compounds capital through volatile cycles by owning strong businesses, hard assets, and dependable cash flows that directly address the major forces shaping 2026 and beyond. Regular rebalancing keeps it aligned as conditions evolve.
B. North American Equity Market Statistics
Canadian Equities
In Q2 2026, the Canadian equity market, as measured by the S&P/TSX Total Return Index, rose 6.8%. Over the past year, the index gained 32.1%, including dividends. Our portfolio of Canadian companies, net of fees, decreased 1.0% during the quarter and was up by 27.1% over the past 12 months, underperforming the index by approximately 5% during the last 12 months. This was a big reversal over the first quarter as our overweight position in precious metals held us back coupled with our underweight in the Canadian banks! Regardless, we are pleased with our positions and look forward to the remainder of the year. Precious metals are well positioned to resume their upward trek and Canadian Banks are trading at very high valuations. Over the past five and ten years, our Canadian holdings achieved annualized returns of 11.3% and 12.1%, respectively. Compared to the S&P/TSX, we underperformed by 2.72% annually over five years but outperformed by .2% annually over ten years.
We remain highly confident in our core holdings and their durable long-term fundamentals, including strong balance sheets, proven management teams, and embedded growth options. As active managers, we stay disciplined in our approach: prioritizing capital preservation while remaining alert to attractive opportunities that can emerge rapidly during periods of market dislocation. As we move into Q3 2026, with stock markets hovering near all-time highs, we are mindful that valuations appear stretched and the environment may be vulnerable to a meaningful correction. Our companies are trading at much better prices and valuations than the overall market.
For the S&P/TSX Composite Index, 8 out of 11 GICS sectors delivered positive returns during Q2 2026. Here is the sector breakdown ranked from highest to lowest quarterly returns.
Financials (+24.7%)
The Financials sector led all groups in Q2 2026 with a strong +24.7% return. Its heavy weighting in the index and broad exposure to domestic and U.S. economic activity made it the largest contributor to the overall market gain.
Health Care (+13.4%)
Health Care posted the second-best return at +13.4%, comfortably outperforming the broader index. The sector benefited from steady demand for its services.
Industrials (+10.3%)
Industrials rose +10.3%, ranking third among the eleven sectors. Performance was supported by strength in transportation, infrastructure, and manufacturing activity.
Consumer Discretionary (+8.4%)
Consumer Discretionary gained +8.4% during the quarter. The sector benefited from steady consumer spending patterns.
Real Estate (+7.4%)
Real Estate delivered a solid +7.4% return. The gain reflected ongoing activity in property management and development.
Information Technology (+6.3%)
Information Technology advanced +6.3%, adding a positive contribution to the index. The sector finished in the middle of the pack.
Consumer Staples (+5.4%)
Consumer Staples recorded a steady +5.4% return, providing defensive exposure in a positive market environment.
Utilities (+5.0%)
Utilities posted a modest but positive +5.0% return, offering stability during the broader market advance.
Energy (-5.8%)
Energy was one of only three sectors to finish lower, declining -5.8%. The result stood in contrast to the strong gains seen across most of the index.
Communication Services (-11.4%)
Communication Services posted the second-worst performance of the quarter, falling -11.4%. The decline weighed on overall index results.
Materials (-11.7%)
Materials finished as the weakest sector, declining -11.7%. This marked a sharp reversal after the sector had been the strongest performer in recent prior quarters.
US Equities
In the second quarter of 2026, our portfolio of U.S. and global companies increased by 3.1% net of expenses. This performance occurred against a strong market backdrop, as major U.S. indices also posted robust positive returns amid a broadening rally. The S&P 500 rose approximately 15.2%, while the Dow Jones Industrial Average gained roughly 12.9%. Several factors contributed to the broader market advance, including strong corporate earnings growth (exceeding 20% year-over-year for the S&P 500), renewed enthusiasm for AI and technology investments, especially semiconductor stocks, broadening participation across market sectors with notable strength in small-cap and value stocks, stabilization in energy prices following de-escalation of geopolitical tensions, and resilient underlying economic fundamentals. Growth-oriented sectors led the rally, while value-oriented and certain defensive areas participated more modestly.
Our portfolio continues to deliver attractive results over longer horizons:
- 5-year annualized return: 9.00%
- 10-year annualized return: 12.0%
These results underscore the long-term compounding power of owning high-quality businesses with strong fundamentals, above-average earnings growth potential, and reasonable valuations, the core of our investment philosophy. Over the past five years, our portfolio underperformed the S&P 500 by approximately 4.7% annualized. Over the 10-year period, that underperformance narrowed to 3.6% annualized. At the same time, we outperformed both the Dow Jones Industrial Average and the Russell 2000 by roughly 1.0% annualized over the full 10-year span.
This pattern is consistent with our approach: we select individual companies based on their own merits rather than trying to match the composition of any index. The S&P 500’s recent outperformance has been driven by a narrow group of large-cap growth stocks. As these leaders face increasing headwinds, focused value portfolios are typically well positioned to outperform broader market indices.
Our holdings are chosen for their ability to compound intrinsic value over time, not to track market-cap-weighted benchmarks. We have navigated similar environments before, most notably during the technology and internet bubble of 1998–2000, and remain focused on protecting investor capital.
For the S&P 500 Composite Index, 8 out of 11 GICS sectors delivered positive returns during Q2 2026. It’s not a surprise given all the hype about AI that the Information Technology sector came out on top! Here is the sector breakdown ranked from highest to lowest quarterly returns:
Information Technology (+31.6%)
The sector delivered the strongest performance in Q2 2026, driven by a powerful resurgence in the AI trade and surging demand for semiconductors and related hardware. Investments in AI infrastructure, data centers, and enterprise solutions fueled robust revenue and margin growth, particularly among chipmakers and memory providers.
Industrials (+14.5%)
Industrials posted solid gains amid renewed focus on domestic manufacturing and infrastructure spending. Policy changes tied to the “One Big Beautiful Bill” boosted interest in the sector, while the “war trade” and rising defense budgets provided additional tailwinds. AI-driven data center buildouts (including power infrastructure, electrical equipment, and cooling systems) also supported performance.
Consumer Discretionary (+9.1%)
The sector benefited from the broad market rally and strength in e-commerce and digital platforms, though consumer spending showed some signs of softening. Amazon (AMZN) was a key driver through its cloud and AI-related growth, helping offset pressures in traditional retail and autos. Overall positive sentiment around economic resilience and selective strength in high-growth areas supported the +9.1% return.
Financials (+8.6%)
Financials advanced on a healthy economic backdrop and resilient corporate activity. Banks and capital markets firms benefited from steady loan demand and trading volumes, while higher interest rates provided some support to net interest margins despite shifting Fed expectations.
Health Care (+8.3%)
Health Care delivered steady gains supported by technological innovation, demographic trends, and operational efficiencies. The sector saw contributions from pharmaceutical and biotech companies, though some earnings revisions created modest headwinds.
Communication Services (+8.1%)
The sector performed well, fueled by accelerating digital advertising and AI monetization opportunities. Mega-cap platforms benefited from strong ad spending and AI-enhanced products, offsetting weaker results from traditional telecom and cable names. Key drivers included Alphabet (GOOGL) and Meta Platforms (META).
Real Estate (+7.6%)
Real Estate posted modest gains amid the overall equity rally, with selective strength in data-center-focused REITs tied to AI infrastructure demand. Traditional office and retail properties faced ongoing challenges, but broader market optimism and expectations around economic activity provided support.
Materials (+1.6%)
Materials delivered modest positive returns, benefiting indirectly from AI-related infrastructure spending (e.g., demand for metals and construction materials). The sector saw some support from industrial activity and capex trends but lacked the explosive momentum seen in tech or industrials. Commodity price movements and global demand dynamics kept gains limited.
Utilities (+0.0%)
Utilities were essentially flat as the sector balanced steady demand (including growing power needs from AI data centers) against higher interest rates and inflation concerns. Defensive characteristics helped it hold steady while more cyclical sectors rallied. Power and electric utilities tied to data center growth provided some offset to broader macro pressures.
Consumer Staples (-0.3%)
Consumer Staples slightly underperformed as defensive demand was tempered by reaccelerating inflation and selective consumer weakness. Stable staples names provided some resilience, but the sector lagged the broader market rally. Companies focused on essential goods saw limited upside amid shifting spending patterns.
Energy (-14.0%)
Energy was the clear laggard, declining sharply as oil prices fell significantly toward quarter-end. The drop followed the U.S. and Iran reaching a Memorandum of Understanding, which eased geopolitical supply concerns and raised expectations for “normalized” oil transport.
Market Statistics
Pertinent market action during Q2 of 2026 and during the last 12 months is captured in the following table.
| June 30, 2025 | Mar. 31, 2026 | June 30, 2026 | 3 Month Return | 1 Year Return | |
| CAD/USD | $0.7349 | $0.7190 | $0.7048 | -1.98% | -4.10% |
| Oil WTI (US $) | $65.11 | $101.77 | $70.08 | -31.14% | +7.63% |
| Gold (US $) | $3,303 | $4,672 | $4,014 | -14.08% | +21.53% |
| Silver (US $) | $36.11 | $75.33 | $58.99 | -21.69% | +63.36% |
| S&P/TSX | 26,857 | 32,768 | 34,857 | +6.38% | +29.79% |
| S&P 500 | 6,205 | 6,529 | 7,499 | +14.86% | +20.85% |
| Cdn 10 yr. | 3.31% | 3.47% | 3.38% | -9 bps | +7 bps |
| US 10 yr. | 4.23% | 4.31% | 4.45% | +14 bps | +22 bps |
The table provides a clear snapshot of key asset performance from the end of Q2 2025 through Q2 2026, highlighting divergent trends across currencies, commodities, and equities.
The following breakdown provides context for each financial metric as of June 30, 2026, highlighting the specific drivers behind the quarterly and annual returns.
Currencies & Interest Rates
• CAD/USD ($0.704): The Canadian dollar weakened 1.98% this quarter. The decline was driven by a sharp drop in oil prices following signs of de-escalation in Middle East tensions, which reduced the traditional tailwind for the Loonie. A widening yield gap in favor of the US dollar further pressured the currency. Canada’s ongoing regulatory and taxation burdens on the energy sector continued to limit investment and structural support for the currency.
• CAD 10 yr. (3.38%): Canadian yields fell 9 bps this quarter. Easing energy-driven inflationary pressures and growing expectations for Bank of Canada easing amid softer growth allowed yields to decline, even as domestic regulatory headwinds persisted.
• US 10 yr. (4.45%): US yields rose 14 bps this quarter. Stronger US economic data, resilient growth, and a shift away from aggressive safe-haven demand (as geopolitical risks moderated) pushed Treasury yields higher.
Commodities
• Oil WTI ($70.08): Oil was the quarter’s biggest decliner, falling 31.14%. The collapse reflected the unwinding of the massive geopolitical risk premium that had built up in Q1, as diplomatic progress and supply adjustments related to the Strait of Hormuz situation eased supply disruption fears.
• Gold ($4,014): Gold fell approximately 14% this quarter, marking a significant correction after its powerful prior rally. Reduced geopolitical tensions and lower oil prices diminished its safe-haven appeal for some, though central bank buying and long-term diversification demand continued to provide a strong floor under its price. The future remains very bright for gold prices given the massive and growing indebtedness of the global economy.
• Silver ($58.99): Silver dropped roughly 21.7% this quarter. The metal gave back much of its earlier gains as industrial demand concerns rose alongside the broader risk-on environment and lower inflation expectations, despite the ongoing structural deficit. We view this as an exceptional opportunity to continue building our exposure to this critical precious metal.
Equity Markets
• S&P/TSX (34,857): The Canadian benchmark gained 6.38% this quarter. While it benefited from the resource tilt, the sharp pullback in oil and precious metals limited its upside compared to the US market. The major contributor to the index was the Canadian Banks.
• S&P 500 (7,499): The S&P 500 surged 14.86% this quarter, its strongest quarterly performance in years. The rebound was fueled by easing energy cost pressures, strong corporate earnings, and a broad risk-on rotation as geopolitical tensions moderated and mega cap tech recovered.
Overall Takeaway
Q2 2026 delivered a dramatic reversal from Q1’s commodity-driven moves. The partial easing of Middle East geopolitical risks triggered a sharp collapse in oil prices, which in turn reduced inflation hedges and safe-haven demand for gold and silver. This environment favored risk assets, producing a powerful equity rally (especially in the US) and a weaker Canadian dollar. Canadian markets still posted solid gains thanks to the banks, but underperformed the S&P 500 as the commodity complex corrected. The quarter highlighted how quickly markets can reprice!
C. Rocklinc Investment Update
1. Private Client Assets- Separately Managed Accounts
Our ROCKLINC separately managed accounts delivered a .5% return in Q2 and a 13% return over the past year (ending June 30, 2026). More significantly, our average annual compound returns over the past 3, 5, and 10 years were approximately 12%, 7.3%, and 8.6%, respectively. These returns are net of fees and reflect an asset allocation of approximately 70% in equities, with the balance in short-term deposit accounts and short-term bonds. Please note that these figures represent aggregate performance across all accounts. Individual client portfolios will vary based on risk tolerance and specific asset allocations.
Our equity portfolio (comprising Canadian, U.S., and global equities) achieved an .5% return in Q2 and a 20.7% return over the past 12 months. Over the past 5 and 10 years, our equities have compounded at approximately 10.1% and 12.0% annually, respectively, aligning with major market indices. Our investment approach remains focused on the economic fundamentals of the businesses we own. We prioritize:
- Selectively adding companies identified through our research team’s analysis.
- Divesting underperforming businesses.
- Capitalizing on market volatility to increase positions at attractive prices.
With the launch of our new Rocklinc Principled Equity Fund ETF in November, we added a handful of new companies to our roster of businesses. Please see our brief writeup on our new ETF for a list of those new companies.
2. Rocklinc Partners Fund
Over the past four years, we have been utilizing the Partners Fund in more of the portfolios we manage. The Fund offers our clients a low cost and efficient way to purchase 16-20 strong businesses in one portfolio. It is an effective way to gain access to a global diversified portfolio with modest amounts of investment capital. Our number one objective is to create a Fund comprised of excellent companies that produce strong long-term performance.
Quarterly, we provide a performance update to our clients. Performance numbers are after all fees and rates of return beyond one year are annual compound rates of return.
Currently, the Fund is 17.3% in cash and short-term money market instruments, including 3 short-term corporate bonds (yielding 2.5 – 3%), 80.1% in publicly traded equities and 2.6% in two private equity investments. We expect our cash and bond weightings to remain in the 10%-20% range given market valuations and investment opportunities. We finished the quarter with $54.6 million in total assets.
During Q2, there were no changes to the holdings in the Fund.
After all expenses, the Rocklinc Partners Fund has been compounding at approximately 8.4% per year since inception (September 29, 2017) and by 12.80% and 7.20% over the past three and five years.
Over the past one and three years, the portfolio’s Canadian equities have compounded at 14.2% and 16.4%, while U.S. equities have compounded at 7.2% and 14.4%. Since inception in September 2017, Canadian equities have returned 11.8% annually, and U.S. equities have returned 11.4%. The Canadian holdings have outperformed the S&P TSX since inception. The U.S. holdings have underperformed the S&P 500 but have outperformed the DJIA and Russell 2000 since inception.
Our top 12 holdings represent approximately 71.8% of the total portfolio and 87% of the equity weighting in the portfolio. The top 12 holdings are Trisura Group (10.4%), Markel Group (7.4), Franco-Nevada Corp. (7.3%), Wheaton Precious Metals Corp. (7.3%), Brookfield Corp. (6.8%), Amazon.com Inc. (6.0%), Cameco Corp (5.2%), API Group Corp. (4.6%), Gold Royalty Corp. (4.3%), Agnico-Eagle Mines Ltd (4.3%), Altius Minerals (4.1%) and Apple Corp. (4.1%).
Precious metals represent our largest sector allocation at 31.5% of the portfolio. While this concentration will likely result in elevated volatility on a quarter-to-quarter basis, we believe the sector is well positioned to deliver one of the strongest performances over the next three to five years, supported by elevated global debt levels and the need to continue to debase fiat currency.
As of June 30, 2026
| 3 mos. | 6 mos. | 1 yr. | 3 yr. | 5 yr. | Inception | |
| RL Partners** | -1.5% | -1.2% | 9.2% | 12.8% | 7.2% | 8.4% |
** Inception September 29, 2017 (NBN1212)
3. Rocklinc Kokomo Fund
In November 2022, we introduced the Rocklinc Kokomo Fund to offer our clients a regulated investment product registered outside Canada. The fund is domiciled in the Cayman Islands, a leading British Overseas Territory and the world’s premier offshore market for investment funds, with all assets securely held in custody in Grand Cayman.
The Rocklinc Kokomo Fund is supported by a robust team of professionals: FundBank serves as the Fund Custodian, SGGG Fund Services (Cayman) Inc. acts as the Fund Administrator, Carey Olsen provides legal counsel, and Grant Thornton (Cayman) is the Fund’s Auditor. The minimum investment is $100,000 USD, with the Net Asset Value (NAV) priced monthly, starting at $100.00 per unit. The portfolio is managed consistently with our discretionary accounts, comprising 15-20 stocks, low turnover, a competitive management fee, no performance fees, and monthly pricing and liquidity. Offering documents are available on our website or by contacting Rocklinc directly.
We began building the portfolio in February 2023 and continue to gradually add to our core positions. As of June 30, 2026, the Fund’s total value stood at approximately $9.0 million USD, with units closing the quarter at $121.96. The Fund delivered a strong return of 20.8% for the full year 2025.The Fund reached a new all-time high on February 28, 2026, at $140.17. However, heightened geopolitical tensions from the war in Iran, combined with a sharp pullback in precious metals led to a 2.19% decline in Q2, bringing the unit value down to $121.96 at quarter-end. Please note: All returns and performance figures are expressed in USD. Consistent client inflows have allowed us to selectively increase existing high-conviction positions, trim underperforming holdings, and introduce several promising new investments. Client interest remains robust, with new investors continuing to join the Fund on a regular basis. We believe there is a lot of upside to the existing portfolio!
As of June 30, 2026, the portfolio consists of 19 equity positions, representing approximately 83% of its total asset value. The remaining 17% is held in a money market fund yielding about 4.1% annually. Our target is to maintain 15–20 equity positions, with overall equity exposure in the 85–90% range, depending on attractive buying opportunities and current valuations. We have been gradually increasing equity holdings while preserving a prudent level of cash reserves. During Q2 we sold our position in Autodesk Inc. and replaced it with Rolls-Royce Holdings plc.
The top 12 holdings by portfolio weighting are:
- Trisura Group Ltd.
- Wheaton Precious Metals Corp.
- Brookfield Corp.
- Altius Minerals
- OR Royalties Inc.
- Gold Royalty Corp.
- Amazon Inc.
- Franco-Nevada Corp.
- Markel Corp.
- Carlisle Co.
- Royalty Pharma plc
- Brookfield Infrastructure
These positions represent approximately 64% of the total portfolio and 77% of the active equity weighting.
4. Rocklinc Principled Equity Fund ETF (TSX: RKLC)
On November 13, 2025, we launched the Rocklinc Principled Equity Fund (TSX: RKLC), an actively managed value-oriented ETF. The fund currently holds 17 equity positions, the vast majority of which are unique and feature minimal overlap with our flagship Rocklinc Partners Fund. This new fund is designed to offer clients enhanced diversification, strong capital protection, and lower overall volatility. As of June 30, 2026:
- Assets under management stood at $40.7 million up from $39.8 at the end of Q1.
- The portfolio was allocated 23.6% to cash, which earned approximately 3.25%, with the remaining 76.4% invested across 17 equity positions. During the Q1, we sold our position in Danaher Corp. and reinvested the proceeds in Royalty Pharma. In Q2, we added Rolls-Royce Holdings PLC to the portfolio (see the detailed write-up on Rolls-Royce later in this report).
The 17 equity holdings, listed by their approximate weighting (highest to lowest) in the portfolio as of June 30, 2026, are:
- Sprott Inc.
- Royalty Pharma plc
- Trisura Group
- Brookfield Infrastructure
- Roper Technologies
- ServiceNow Inc.
- OR Royalties
- Cameco Corp.
- Agnico Eagle Mines
- Royal Gold Inc.
- MercadoLibre Inc.
- Prologis Inc.
- Kinsale Capital Group
- American Coastal Insurance
- Carlisle Companies Inc.
- Burford Capital Ltd.
- Rolls-Royce Holdings plc
The following commentary reviews our major holdings by sector exposure.
The Royalty and Gold Mining Segment
Sprott Inc., Agnico Eagle Mines, OR Royalties, and Royal Gold showed resilience amid a sharp correction in gold prices. Gold began the quarter near $4,700/oz, peaked early around $4,840, then retreated significantly, closing Q2 near $4,008/oz, a decline of roughly 14% for the quarter, following all-time highs above $5,500 earlier in 2026. This environment created headwinds for gold-price-sensitive areas: Sprott faced some pressure on assets under administration from market value depreciation in its physical trusts and related products, following strong Q1 gains, though structural demand for precious metals exposure remained intact. Agnico Eagle maintained solid operational momentum and production tracking, with strong margins supported by still-elevated gold prices versus historical levels, even as realized prices moderated from Q1 peaks. Royalty-focused names performed more steadily. OR Royalties delivered strong preliminary Q2 results with 20,757 gold equivalent ounces (GEOs), approximately $97.8 million in royalty and stream revenues, and an exceptional ~96.8% cash margin; it also increased its quarterly dividend. Royal Gold similarly benefited from prior high metals prices in Q1 reporting and is positioned for solid results in Q2.
Infrastructure, Insurance, and Industrial Holdings
Brookfield Infrastructure, Trisura Group, Kinsale Capital, American Coastal Insurance, Carlisle Companies, Roper Technologies, Prologis and Rolls-Royce Holdings remained resilient overall. These businesses continued to benefit from their defensive characteristics, contractual or pricing-power-driven revenue streams, and quality balance sheets. Specialty insurers (e.g., Kinsale, Trisura) operated in a favorable pricing and disciplined underwriting environment. Quality compounders such as Roper Technologies and Prologis continued to trade at valuations offering attractive long-term margins of safety, despite broader market volatility and mixed sentiment. Brookfield Infrastructure reported solid Q1 results (with Q2 reporting expected late July) and maintains a track record of stable, inflation-linked or utilization-driven cash flows.
Technology and Growth-Oriented Names
ServiceNow, MercadoLibre, Cameco, Burford Capital and Royalty Pharma continued to show varied performance. ServiceNow faced some ongoing valuation pressure related to AI-related concerns and growth expectations, though its durable competitive advantages and platform strength remain intact at current levels. We believe that the company has tremendous upside and the market is pricing the business incorrectly. Cameco benefited from secular tailwinds in the energy transition and uranium demand. Burford Capital continued to demonstrate leadership in complex litigation finance, offering significant upside potential tied to its unique business model, albeit with the inherent volatility of case outcomes and realizations. Royalty Pharma continued to demonstrate resilient cash flows from its diversified biopharma royalty portfolio, with Q1 results (reported in May) showing double-digit growth in Royalty and Portfolio Receipts and raised full-year guidance; the stock traded near or at new 52-week highs and remained attractively valued relative to its stable, high-quality cash flow profile.
Overall, the portfolio’s emphasis on high-quality businesses purchased with a margin of safety, particularly those with royalty-like or predictable economics, strong balance sheets, and pricing power, helped it navigate a volatile quarter marked by the gold price correction and shifting market sentiment. We remain focused on intrinsic value, patient capital allocation, and avoiding overvalued speculative areas. No changes to our core conviction holdings as we enter the third quarter. Rocklinc Investment Partners continues to prioritize long-term compounding through disciplined value investing.
For the most current details, including holdings, performance, and prospectus, please visit rocklinc.com or contact us directly.
D. Company Focus – Rolls-Royce Holdings plc (RYCEY:US)
The company is a global leader in mission-critical power and propulsion systems for aerospace, defence, and industrial applications. It should not be confused with BMW Group’s Rolls-Royce Motor Cars subsidiary.
Brief History and Heritage
Rolls-Royce traces its aviation roots to the early 20th century. A notable early milestone was powering the first successful non-stop transatlantic flight in June 1919, when British aviators Captain John Alcock and Lieutenant Arthur Brown flew a modified Vickers Vimy biplane from Newfoundland to Ireland using two Rolls-Royce Eagle engines. The company has since become a key player in commercial and military aviation engines, naval propulsion, and power systems.
Business Overview
Rolls-Royce operates through three main segments (2025 underlying revenue breakdown):
- Civil Aerospace (≈52% of revenue): A leader in widebody commercial aircraft engines, powering platforms such as the Boeing 787 Dreamliner, Boeing 777, and Airbus A330/A350 families. It also serves the business aviation market (e.g., Bombardier, Gulfstream, Dassault). A significant and growing portion of revenue comes from high-margin aftermarket services under long-term contracts (often 20+ years) tied to engine flying hours. In 2025, Civil Aerospace services revenue reached £7.2 billion out of £10.4 billion total segment revenue.
- Defence (≈24% of revenue): Provides military aero engines, naval gas turbines, and submarine nuclear propulsion systems. It holds long-standing positions with the UK and allied forces (including exclusive nuclear reactors for the UK Royal Navy submarine fleet for over 70 years) and recently won the U.S. Air Force contract to re-engine the B-52 Stratofortress. Recurring service revenue exceeds 50% of the segment, supported by engine lifespans that can exceed 50–80 years.
- Power Systems (≈24% of revenue): Offers industrial power generation, diesel and gas engines, marine propulsion, and backup power solutions. Growth areas include data centres, utilities, mining, and integration with renewables via battery energy storage. Rolls-Royce is also advancing Small Modular Reactor (SMR) technology for nuclear power, with awards in the UK, Czech Republic, and Sweden.
The business benefits from a large installed base of long-life engines and a high proportion of recurring, high-margin aftermarket revenue (historically around two-thirds of the aerospace-related business).
Financial Performance – FY 2025 (Year Ended 31 December 2025)
Rolls-Royce delivered strong results following a multi-year transformation focused on portfolio optimization, operational efficiency, simplification, digitization, contract renegotiations, and cost discipline.
Key underlying metrics (organic basis):
- Revenue: £20.06 billion (+14% YoY from £17.85 billion)
- Operating profit: £3.46 billion (+38–40% YoY from £2.46 billion)
- Operating margin: 17.3% (vs. 13.8% in 2024)
- Civil Aerospace: 20.5%
- Defence: 14.4%
- Power Systems: 17.4%
- Free cash flow (FCF): £3.27 billion (vs. £2.43 billion)
- Return on capital: 18.9% (vs. 13.8%)
- Basic EPS: 29.55p (underlying; statutory 69.41p)
- Net cash position: £1.9 billion (improved from net debt position in prior years; gross debt reduced to £2.8 billion)
Capital returns:
- Total dividend for 2025: 9.5p per share (final 5.0p; ≈32% payout ratio of underlying profit after tax)
- Share buybacks: £1 billion completed in 2025; multi-year programme of £7–9 billion announced for 2026–2028 (£2.5 billion targeted for 2026)
Investment Perspective – Long-Term Disciplined Value Investor View
Rolls-Royce possesses durable competitive advantages: deep technological expertise, an oligopolistic position in widebody aero engines (alongside GE Aerospace and Pratt & Whitney), a massive installed base generating sticky, high-margin recurring aftermarket revenue, and long asset lifespans that support predictable cash flows.
The post-2022/2023 turnaround has been impressive. Operating profit and free cash flow have roughly quintupled in recent years, margins have expanded significantly, and the balance sheet has shifted to a net cash position. Return on capital has risen to nearly 19%, reflecting improved capital discipline and operational leverage.
Valuation context (as of mid-July 2026):
- Market capitalization: ≈ £119–120 billion
- Trailing P/E: ≈ 21x (on statutory 2025 EPS)
- Enterprise value metrics reflect a premium valuation consistent with the turnaround success and growth outlook
From a value investor standpoint, this is a high-quality compounder rather than a deep-value bargain. The business now generates substantial free cash flow, supports growing dividends and aggressive buybacks (returning a high percentage of FCF), and benefits from secular tailwinds: recovering and growing commercial aviation flying hours, elevated defence spending, data centre/power demand, and the long-term shift toward reliable low-carbon energy (including SMR nuclear).
Key growth opportunities include:
- Further aftermarket expansion and engine time-on-wing improvements in Civil Aerospace
- New programmes (e.g., Pearl 10X business jet engine deliveries starting 2027)
- Defence programme ramps and geopolitical spending
- Power Systems expansion in high-growth end markets and SMR deployment
Risks to monitor include aviation cyclicality, execution on new engine programmes, supply chain or geopolitical disruptions, currency exposure (mitigated by significant USD revenue), and competition in new areas.
Overall, Rolls-Royce represents a transformed industrial leader with improving returns on capital, a fortress balance sheet, and multiple avenues for long-term earnings and cash flow growth. For patient, disciplined investors focused on quality businesses with durable moats and shareholder-friendly capital allocation, it offers a compelling profile at current valuations, particularly if margins and cash conversion continue to expand toward mid-term targets. Overall, the business provides diversified exposure to important secular themes postioned to take full advantage of three growth areas in aviation, defence, and energy infrastructure.
E. Moving Forward
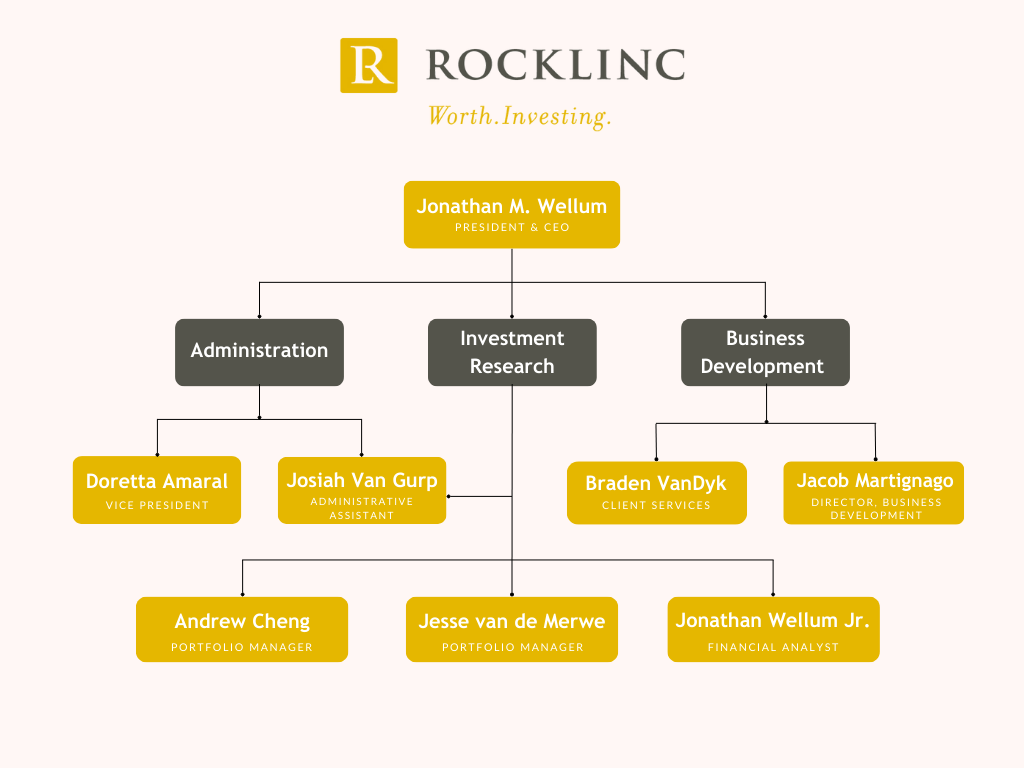
We continue to keep our eyes focused on the fundamentals of the businesses we invest in, within the context of a struggling global economy. We will do our best to take advantage of sharp moves in the market! We currently have eight full-time employees. Here is our organizational chart.
The investment team at Rocklinc is diligently managing our portfolio companies to meet or exceed expectations while seeking new opportunities to enhance your investments. Despite tariffs, trade tensions, or military activities, our core strategy remains unchanged: building portfolios of exceptional businesses. Below are ten key principles guiding our approach:
- Patience: We wait for attractively priced opportunities, leveraging our cash reserves to buy low during volatile periods. Tariff-related uncertainty, along with hostilities in the Middle-East and Europe may create short-term noise but also long-term opportunities. Quality companies at compelling valuations reward investors who focus on fundamentals, not headlines.
- Monitor Central Banks: Monetary policies—such as suppressed interest rates and expanding money supply—significantly influence market valuations. Central bank policies are generally not supportive of strong currencies. We will closely monitor the actions of the new Federal Reserve Chair, Kevin Warsh, to assess their potential impact on capital markets.
- Address Unsustainable Deficits: Government deficits pose risks to purchasing power. We maintain significant positions in precious metals and hard assets to mitigate these risks, despite volatility.
- Diversify Strategically: Our focused portfolios (25-30 securities) are diversified across asset classes, sectors, and regions to balance risk and opportunity.
- Prioritize Strong Balance Sheets: We invest in companies with tangible assets, robust financials, and minimal counterparty risk.
- Focus on Essential Industries: We target firms in growing sectors with long-term secular trends.
- Avoid High-Risk Firms: We minimize exposure to heavily leveraged financial companies with complex balance sheets, such as banks and insurers.
- Maintain Liquidity: Adequate cash reserves allow us to capitalize on market dislocations, earning 3.0% – 4.0% annually while preserving flexibility.
- Stay Opportunistic: We remain positive and proactive, grounded in realism and truth.
- Anchor in Faith: “Blessed is the man who trusts in the Lord, whose trust is the Lord.
He is like a tree planted by water, that sends out its roots by the stream, and does not fear when heat comes, for its leaves remain green, and is not anxious in the year of drought, for it does not cease to bear fruit.” Jeremiah 17:7-8 ESV
For questions about your account, please contact us to schedule an appointment.
ROCKLINC INVESTMENT PARTNERS INC.
Contact Information
ROCKLINC INVESTMENT PARTNERS INC.
4200 South Service Road, Suite 102
Burlington, Ontario
L7L 4X5
Tel: 905-631-LINC (5462)
www.rocklinc.com
| Doretta Amaral | damaral@rocklinc.com | (ext. 1) |
| Jonathan Wellum | jwellum@rocklinc.com | (ext. 2) |
| Jesse van de Merwe | jvandemerwe@rocklinc.com | (ext. 3) |
| Braden Van Dyk | bvandyk@rocklinc.com | (ext. 4) |
| Andrew Cheng | acheng@rocklinc.com | (ext. 5) |
| Jacob Martignago | jmartignago@rocklinc.com | (ext. 6) |
| Jonathan Wellum Jr. | jwellumjr@rocklinc.com | (ext. 7) |
| Josiah Van Gurp | jvangurp@rocklinc.com | (ext. 8) |
Disclaimer