A. North American Equity Market Statistics
During the third quarter, the Canadian equity market, as measured by the S&P/TSX total return index, increased by 10.3%. Year-over-year, the index increased 25.7%, including dividends. Global markets continued to focus on the actions of the major Central Banks, which have started to cut interest rates from 20-year highs. As we discussed in our last two quarterly reports, several of our favourite businesses continue to trade at substantial discounts to what we believe is their intrinsic value. This is providing us with unique opportunities to increase our weightings in these companies. Here are ten businesses we own in client accounts that we believe are trading at greater than 15% discounts, with several trading at greater than 25% discounts to intrinsic value:
Altius Minerals, APi Group, Brookfield Corporation, Burford Capital, Franco-Nevada Corporation, MEG Energy, Osisko Royalties, Sandstorm Gold Ltd, Trisura Group and Wheaton Precious Metals. We have added to most of these postions during the quarter. We also iniatated two new positions, Markel Group and Burford Capital. Later in this report, we have an overview of Burford Capital and why we established a significant stake in this business. In order to make room for Burford Capital, we eliminated our long- standing position in TD Bank. Given TD’s current woes and recent settlement with the regulators in the US, our timing could not have been better.
Canadian Equities
During the third quarter, our basket of Canadian companies (after all expenses) increased by 12% and, over the past 5 and 10 years, compounded annually at 9.5% and 9.1%, respectively. During the quarter, we outperformed the index by 1.6%. Over the past 5 years, we underperformed the index by .56% and over the last 10 years, we outperformed the index by 1.8%, compounded annually. Our weighting in the precious metals royalty companies, along with our weighting in infrastructure businesses, energy companies and Trisura Group have added significant value over the past few years. We continue to focus on the long-term economic fundamentals of the companies we own. We are pleased with our core positions and their favourable long-term fundamentals and continue to fine-tune our positions month-by-month.
In terms of the S&P/TSX index, all eleven sectors generated positive returns during the third quarter. Their returns from highest to lowest: Real Estate (+21.9%), Healthcare (+15.8%), Financials (15.8%), Utilities (+15.3%), Information Technology (+14.0%), Materials (+11.7%), Communication Services (+8.7%), Consumer Discretionary (+7.2%), Consumer Staples (+5.5%), Industrials (+2.4%), and Energy (.8%).
US Equities
During the third quarter of 2024, our portfolio of U.S.-based companies (after all expenses) increased by 2.0% and, over the past 5 and 10 years, compounded annually at 10.2% and 12.9%, respectively. During the quarter, we underperformed the S&P 500 index by approximately 2.9%. The challenge with the S&P 500 index is that it continues to be dominated by a handful (5 -7 companies) that have driven the index. We refuse to chase stocks and we will not buy stocks based on momentum. The basket of companies we own represent reasonable value and possess the characteristics to outperform other businesses in the coming years.
Over the past 5 years, we have trailed the S&P 500 index by 3.8% and over the past 10 years trailed the index by .48% annually. When compared to the Dow Jones Industrial Average (DJIA), we outperformed the index by .63% and 3.32% over the past 5 and 10 years, respectively. If we look at the Russell 2000 which is a measure of smaller capitalization securities, we outperformed the index by 2.19% and 5.51% annually over the past 5 and 10 years, respectively.
Most recently, the returns in the U.S. markets have been dominated by a handful of businesses. Most of them are trading at extremely high valuations, propelled by the excitement surrounding artificial intelligence (AI). There is no question that AI will have a massive influence on our economy but that does not give us license to chase overvalued securities and speculate on future returns. It is our long-term discipline that will produce the consistent returns demanded by our investors.
Given the size of the U.S. market, most of the new holdings we have added to our portfolios over the past 2-3 years have been global businesses domiciled in the U.S. We continue to scour the world for opportunities. Expect us to add and subtract 2-3 companies from our portfolios each year. As mentioned earlier in this report, we added two new business during the quarter, Markel Group and Burford Capital.
Market Statistics
Pertinent market action during the third quarter of 2024 and during the last 12 months is captured in the following table.
| Sept. 30, 2023 | June 30, 2024 | Sept. 30, 2024 | 3 Month Return | 1 Year Return | |
| CAD/USD | $0.7365 | $0.7307 | $0.7392 | +1.16% | +0.37% |
| Oil WTI (US $) | $90.79 | $81.52 | $68.20 | -16.34% | -24.88% |
| Gold (US $) | $1,848.63 | $2,323.39 | $2,634.00 | +13.39% | +42.53% |
| Silver (US $) | $22.18 | $29.10 | $31.11 | +6.91% | +40.26% |
| S&P/TSX | 19,541 | 21,893 | 24,000 | +9.62% | +22.81% |
| S&P 500 | 4,288 | 5,460 | 5,762 | +5.50% | +34.40% |
| Cdn 10 yr. | 4.02% | 3.50% | 2.96% | -54 bps | -106 bps |
| US 10 yr. | 4.57% | 4.38% | 3.78% | -60 bps | -79 bps |
During the third quarter, the Canadian dollar increased by 1.2% against the USD and was up .37% over the last twelve months, after several quarters of underperformance. Overall, the USD continues to be quite strong and has advanced against every major currency in the world over the past few years. As we have pointed out in other reports, don’t confuse this with a strong dollar! The US fiscal situation is atrocious with the US adding to its massive $36 trillion debt at a rate of over $2 trillion per year! The interest on their debt is now their largest discretionary line item at over $1 trillion per year. If the US dollar is strong, it is a good indicator of the weakness of most global currencies. This is why gold continues to trade higher along with some of the cryptocurrencies. Confidence in fiat currencies continues to erode.
The best way to minimize currency risk is to buy strong and growing businesses that generate revenue in numerous currencies and are backed by hard tangible assets. As a result, these businesses create a natural currency hedge in your portfolio and mitigate the impact of fluctuating currencies and inflation. Our view, which we have held for the past 15 years, is that all fiat currencies will continue to lose value against tangible or real assets. This is because governments around the world are fiscally irresponsible (run large budget deficits and accumulate large debts), and through their central banks, continue to print record amounts (through the whole business cycle) of money to support their indebted economies.
During the quarter, gold jumped by 13.4% and is up 42.5% over the past twelve months. It finished the quarter at $2,634. Silver was also stronger during the quarter and increased by 6.9% and was up by 40.3% over the past year. We believe the long-term trends for both of these precious metals are to the upside and we continue to build positions in this sector. In fact, many of the precious metals mining companies and royalty businesses are undervalued relative to the price of gold and silver. Our major positions continue to be royalty companies Franco-Nevada, Gold Royalty Corp., Osisko Royalties, Royal Gold, Sandstorm Gold, Wheaton Precious Metals and leading miner Agnico Eagle Mines. We believe that these businesses are beautifully positioned to benefit from global turmoil, overindulgent governments and rising precious metals prices. Currently, they are trading at discounts to intrinsic value, with several trading at significant discounts.
During the quarter, oil decreased by 16.3%, while year-over-year oil is now down 24.9%. Currently, oil prices are averaging $70-$75 per barrel, which is very profitable for the industry and the companies we own in your portfolios. Continued geopolitical shocks will only increase the price of each barrel of oil and drive up the value of our oil investments. Our direct investments in the oil and gas sector remain relatively small (less than 6% of our total assets) and we continue to look at ways to profit from the fool-hearty and short-sighted “green agenda”.
During the third quarter, interest rates edged lower as inflation started to tick lower and the major global economies started to flirt with recessionary conditions. The 10-year Canadian bond decreased by 54 bps and the US 10-year treasury decreased by 60 bps during the quarter. Year-over-year, the yields were down by 106 bps and 79 bps on the 10-year Canadian and 10-year US bonds. With the reckless spending on the part of many governments continuing, including the Canadian and US governments, inflation is remaining stubbornly high. We expect inflation to settle down, provided governments stop deficit spending at the levels we have seen over the past few years. But we are not holding our breath! While we wait for financial prudence to return, we continue to keep our fixed income exposure short-term, liquid and only invested in the highest quality securities.
B. ROCKLINC Investment Update
Private Client Assets – Separately Managed Accounts
In terms of our ROCKLINC separately managed accounts, they increased by 4.5% during the third quarter, 11.2% year-to-date and increased by 16.5% during the last 12 months (period ending September 30, 2024). More importantly, our average annual compound rate of return over the past 3, 5 and 10 years is clocking in at approximately 4.6%, 6.8% and 7.5%, respectively. Returns are after all fees, and are based on an asset mix of approximately 68% invested in equities, with the remainder invested in short-term deposit accounts and short-term bonds. Please note that the performance we are disclosing is our aggregate performance across all our accounts. Each client’s portfolio is unique and performance will vary, based on your risk tolerance and your specific asset allocation.
When we dig further into our numbers, we find that our basket of equities (Canadian and U.S.) were up by approximately 7.4% during the third quarter and up by approximately 25.4% during the past 12 months. Our equities have been compounding by approximately 9.8% over the past 5 years and by 10.6% over the past 10 years keeping pace with the major indexes.
We continue to focus on the economic fundamentals of the businesses we own. This means that we first, selectively add companies as our research team ferrets out new opportunities. Second, prune underperforming businesses. Third, take advantage of market swings and add to existing positions at better prices!
During the first three quarters of the year, we started to build new positions in APi Group (see write- up in first quarter report), Brookfield Corporation, Burford Capital (see write-up later in this report), Cameco and Markel Group. We also added significantly to Amazon, Trisura, MEG Energy, Schneider Electric and several of our precious metals companies. We trimmed positions in Church & Dwight, Suncor Energy and eliminated our position in American Tower and TD Bank. We have also lightened our exposure to two REITS. Throughout 2024, we have been very active in working to ensure we are invested in the best businesses we can ferret out. That means we are looking for businesses that are growing quickly, have strong balance sheets and are trading at attractive prices.
ROCKLINC Partners Fund
Over the past three years, we have been utilizing the Partners Fund in more of the portfolios we manage. The Fund offers our clients a low cost and efficient way to purchase our top 20-30 companies in one portfolio. It is an effective way to gain access to a global diversified portfolio with modest amounts of investment capital. Our number one objective is to create a Fund comprised of excellent companies that produce strong long-term performance.
Quarterly, we provide a performance update to our clients. Performance numbers are after all fees and rates of return beyond one year are annual compound rates of return. Currently, the Fund is 19% in cash and short-term money market instruments (yielding 4 – 5%), 79% in publicly traded equities and 2.0% in one private equity investment. We expect our cash weighting to remain at similar levels for the remainder of 2024. At the time of writing this report in early October, the total assets in the fund exceeded $26 million for the first time, up from $21 million at the end of June and $13.7 million at the beginning of this year.
During the third quarter of 2024, we eliminated four companies, added two new companies and substantially increased our position in two existing business. We sold our entire positions in Brookfield Infrastructure, Brookfield Renewable, Alphabet (Google), and CoStar Group. In the case of the two Brookfield companies we decided to move the capital from these two businesses and invest the proceeds in Brookfield Corporation, the parent company. We now have over 10% of the Fund invested in Brookfield Corporation which trades at an attractive price and gives us exposure to all of the Brookfield businesses. In eliminating our position in Alphabet, the parent company of Google, we decided to substantially increase our position in Amazon which we believe trades at a more attractive price and offers a higher rate of growth. Lastly, we added Markel Group and Burford Capital as new positions to the portfolio. For more information on Burford Capital, refer to our company profile in this report. As new money flows into the fund we will add to existing positions based on the valuations of the companies in the portfolio.
After all expenses and fees, the ROCKLINC Partners Fund has been compounding at approximately 7.2% per year since inception (seven years) and 7.6% over the past five years.
When you look through to the equities in the portfolio, the Canadian stocks have been compounding at 10.7% and the U.S. equities have been compounding at 11.0% over the past five years. During the same five-year period, the S&P/TSX total return index compounded at 10.0%, the S&P 500 compounded at 15.9% and the Dow Jones Industrial Average at 9.5%.
Our top 12 holdings represent approximately 64% of the total portfolio and 74% of the equity weighting in the portfolio. The top 12 holdings are Trisura Group (11.8%), Brookfield Corporation (10.0%), Amazon (6.9%), Roper Technologies (5.3%), Apple Inc. (5.1%), Wheaton Precious Metals (4.2%), Franco-Nevada (4.1%), Markel Group (3.6%), Burford Capital (3.5%), MEG Energy (3.3%), Sandstorm Gold (3.0%), and Autodesk (2.9%).
As at September 30, 2024
| 1 mos. | 3 mos. | YTD | 1 yr. | 3 yr. | 5 yr. | |
| RL Partners** | 2.1% | 3.8% | 12.2% | 17.2% | 5.0% | 7.6% |
ROCKLINC Kokomo Fund
In November 2022, we launched our ROCKLINC Kokomo Fund in order to assist some of our clients and provide them with an investment product that is regulated and registered outside of Canada. Our Kokomo Fund is registered in the Cayman Islands and all funds are held in custody in Grand Cayman. It is important to point out that the Cayman Islands are a British Overseas Territory and the world’s number one offshore market for investment funds.
The Fund Custodian for the ROCKLINC Kokomo Fund is FundBank, the Fund Administrator is SGGG Fund Services (Cayman) Inc., the Fund’s legal counsel is Carey Olsen, and Fund’s Auditor is Grant Thornton (Cayman). The minimum investment is $100,000 USD. The Net Asset Value (NAV) of the Fund is priced monthly and started at $100.00 per unit. We are managing the portfolio in a similar manner to how we manage all our discretionary accounts. This will include 20-25 stocks, low turnover, a competitive management fee, no performance fees and monthly pricing and liquidity. Offering documents are available on our website or by calling us at ROCKLINC.
We started making investments in the portfolio in February 2023 and continue to add slowly to our core positions. As at September, 2024, the Fund had a total value of approximately $6.5 million USD. The units closed at $111.66 at the end of the third quarter. There has been a consistent flow of money into the Fund providing us with tremendous opportunities to add to our existing positions, trim underperforming businesses, and add new positions to the portfolio. Client interest is strong and we are continuing to add new clients into the portfolio each month.
As of September 30th, we have 21 equity positions in the portfolio representing approximately 79% of the total value of the assets. The remaining 21% is invested in a money market fund currently earning approximately 4.5% per year. Our objective is to keep the number of equities in the portfolio around 20 and not more than 25, and increase the equity weighting up to 85-90% based on buying opportunities and valuations. We are patiently adding to our equity weights, while keeping cash on the sidelines.
We have been quite active during the last six months. We eliminated our position in American Tower and rolled the proceeds into API Group. We discussed API Group in our first quarter newsletter and believe it offers a higher rate of return over the next 3-5 years without some of the long-term risks of the tower business. We sold our position in Intercontinental Exchange, which was fully valued, and built a new position in Schneider Electric. Schneider is well positioned to take advantage of the transition to electric vehicles, as they help utilities build more capacity, and are a critical part of building new data centres to facilitate the growth in AI (artificial intelligence). In September, we sold our position in Brookfield Renewable and rolled the proceeds into its parent company, Brookfield Corporation. Lastly we initiated positions in Markel Corporation and Burford Capital. Burford is discussed in more detail in the next section.
Our top 12 companies in the portfolio by portfolio weighting are Trisura Group Ltd, Brookfield Corporation, Wheaton Precious Metals, Brookfield Infrastructure, Markel Group, Amazon, Osisko Royalties, Burford Capital, Roper Technologies, Franco-Nevada Corporation, Gold Royalty Corp. and Apple Inc. These businesses represent approximately 61% of the total portfolio and 76% of the active equity weighting in the portfolio.
C. Company Update – Burford Capital (BUR)
Third-party litigation funding traces its origins to the English common law doctrines of Maintenance and Champerty, which aimed to prevent outside interference in medieval legal proceedings by corrupt nobles and royal officials. Maintenance refers to the practice of financially supporting another party’s lawsuit, while Champerty occurs when the party providing that support receives a share of the proceeds from the outcome. The purpose of these doctrines was to protect a vulnerable court system from being exploited for purposes other than achieving justice. Australia became the first country to abolish Champerty laws when New South Wales passed the Maintenance, Champerty and Barratry Abolition Act in 1993. This change allowed external parties to fund class action lawsuits, which were notoriously expensive. Investors quickly recognized the opportunity and began funding a wide range of cases. Today, nearly all major class actions in Australia are funded by private litigation finance companies.1 As more countries eliminated these doctrines, litigation funding rapidly spread to the United Kingdom and North America, growing into a massive industry. Today, nearly 40 funders manage over $15 billion in capital, proving to be a valid instrument for ensuring access to justice.
As the world’s leading litigation funder, Burford provides capital to large corporations and law firms to finance commercial litigation claims in exchange for a share of the damages if the lawsuit is successful. Pursuing a lawsuit requires significant capital due to legal and investigative expenses coupled with the unpredictable timing of court proceedings. Over time, this can strain a corporation’s cash reserves, negatively affect its earnings and distract investors. Complex commercial disputes are often a long and arduous endeavour with no guaranteed resolution in sight, and many companies lack the expertise, time, or capital to handle these cases independently. With a primary focus on profitability and growing shareholder value, corporations increasingly have embraced litigation financing, allowing them to concentrate on their core business operations. Similarly, law firms also face difficulties managing lengthy litigation, particularly when clients struggle with compensation, as lawyers wish to be paid by the hour for their work. As law firms prioritize winning cases and maintaining client satisfaction, many of the top law firms have turned to third-party litigation financing. This allows them to secure payment on their terms, uphold their reputation, and attract new clients, while mitigating excessive financial and contingency risks. Corporations and law firms are eager to partner with Burford, gladly providing them with a well- deserved portion of their winnings for bearing the substantial obligations and risks of pursuing the litigation.
When Burford provides capital to parties it is non-recourse, meaning the capital is not a loan or debt. If a case goes to trial and is won, Burford will profit from the successful claim, however if the case is lost, Burford will not receive back the capital it used to fund the trial. Fortunately, Burford rarely funds cases which lose at trial due to their excellent track record over the past 15 years. This success is driven by their prudent underwriting expertise and unique proprietary dataset, which has proven to provide a high probability of identifying potentially successful cases after overseeing thousands of cases over the years. Any specific details concerning case settlements are strictly confidential. Since Burford plays a pivotal role in the litigation process by providing capital, they have access to this valuable information, which informs their decision-making for future case selection and provides a substantial advantage against their competitors. The company primarily relies on its balance sheet and some additional third-party capital from institutional investors to finance its legal investments, which enables them to add larger and more complex cases to its portfolio. With a legal finance portfolio of over $7 billion, Burford is by far the largest player in this unique asset class, ensuring that only the most significant and high-profile clients seek Burford when in need of third-party funding for their commercial disputes.
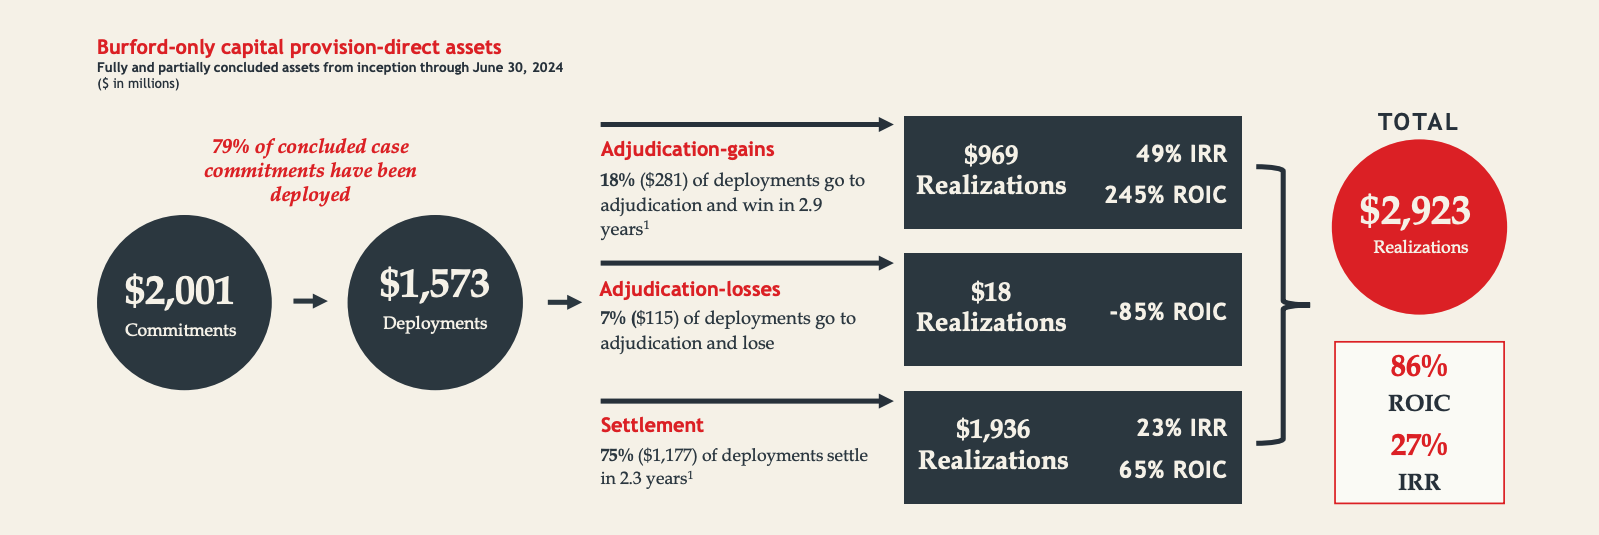
The graphic below summarizes Burford’s outstanding performance since its inception 15 years ago. You can see that Burford has deployed approximately $1.6 billion of capital into commercial litigation cases over the past 15 years, which has returned $2.9 billion to the firm. A cumulative weighted average return on invested capital (ROIC) of 86% or a 27% internal rate of return (IRR). The vast majority of cases (75%) settle without going to court and generate excellent returns (23% IRR and 65% ROIC). When cases win at trial, the returns are phenomenal (245% ROIC and 49% IRR), given these higher-risk cases are often longer in duration. Only 7% of cases are lost at trial, which translates to a 93%-win rate for Burford. As they gain more experience, their success rate continues to edge higher, enabling them to fund cases with a higher probability of success and compound investors capital.
At first glance, Burford’s business model appears risky and unstable. Cash flows are irregular and earnings can be unpredictable, making it unattractive to many investors and underappreciated by the market. The proper way to look at their business is through a long-term lens. When we look at the business we see a business in a growing sector with a longstanding track record of generating significant, predictable, cash-on-cash returns. Since courts operate independently of most economic factors—such as changes in interest rates, inflation, and geopolitical issues—Burford’s returns are largely uncorrelated with broader market conditions. As long-term investors, we believe Burford can substantially compound its earnings and deliver tremendous value to shareholders through its inimitable strategy, without concern for short-term fluctuations. Burford’s model is often compared to private equity investments, where limited partners are locked into their investments for a lengthy time period and rely on an active market to exit and realize returns. In Burford’s instance, not only do investors earn impressive returns from cases that typically conclude within 2-3 years, but every single case benefits from an assured exit due to the nature of the court system.
Today, the company is climbing back to its pre-2019 levels, as courts have been working through the very large backlog of cases that were put on hold during COVID (2020-2021). Burford has begun seeing a rise in realizations (cash from concluded cases) as backlogged cases are cleared through the courts. This new cash is being quickly deployed in new opportunities.
One prominent case belonging to Burford is the Argentine government’s expropriation of their largest oil company, YPF in 2012. Burford provided capital to two YPF minority shareholders, Eton Park and Peterson Energía, who filed a lawsuit against the Argentine government. Peterson went bankrupt following Argentina’s initial 25% stake in YPF, while Eton Park had to cease its operations in 2017 after years of poor performance. In March of 2023, a US judge ordered Argentina to pay $16 billion in damages plus interest to the two shareholders, with Burford’s portion of the judgement worth approximately $6 billion, nearly double its current market value. Whether Burford will receive the entirety of the judgement, and when, is still uncertain. Argentina has appealed the judgement while an enforcement process has commenced, but for now, it is likely the case will settle somewhere in the middle. Despite this, the YPF case is a significant win for Burford and is a prime example of the 18% of cases that go to trial and produce outstanding returns.
We are pleased to invest in Burford, a high-quality business that is very difficult to replicate and generates high returns on capital. Burford’s management eats its own cooking. The two co-founders own over 10% of the business and have aligned themselves with their shareholders, a sign of confidence in their business. We believe the runway in this market is great and developing quickly, as corporate litigation is on the rise. US tort actions alone are estimated to consume 1.85-2.13% of US GDP annually, according to the US Chamber of Commerce Institute for Legal Reform, with commercial liability growing at a much faster rate than personal2.
We initiated our position in Burford by exiting our previous position in TD Bank. We believe Burford offers better long-term potential at a very attractive valuation for a financial firm without all the leverage inherent in a bank. With the global debt crisis getting worse by the day, our interest in highly leveraged financial institutions remains very low.
D. Moving Forward
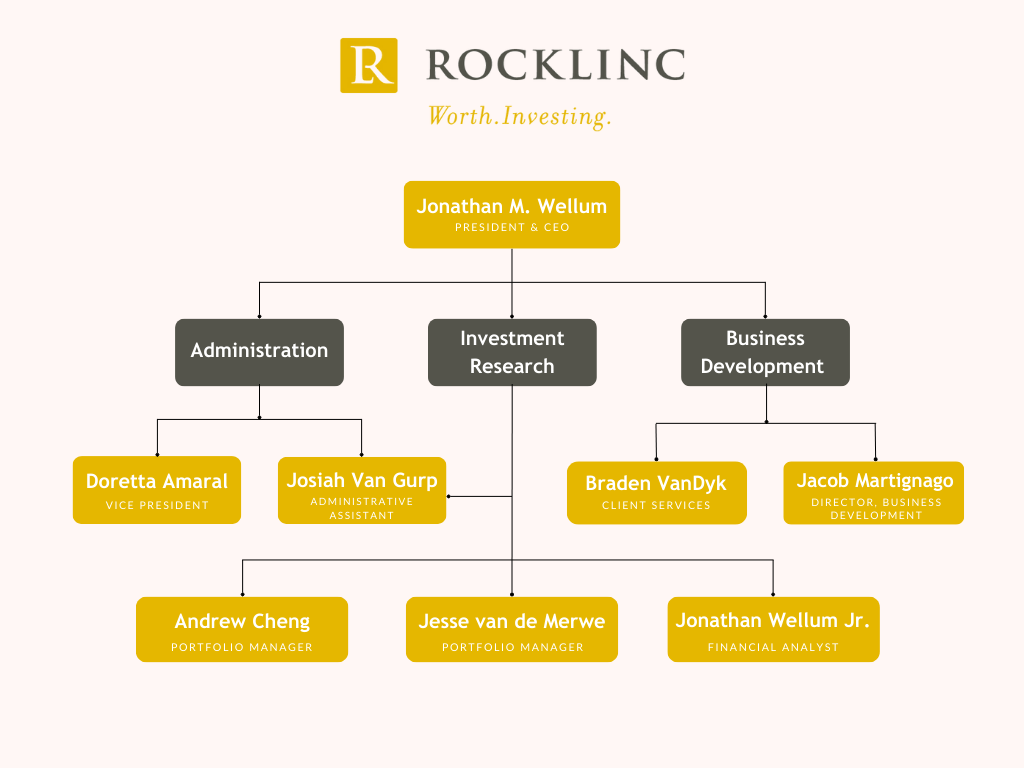
We continue to keep our eyes focused on the fundamentals of the businesses we invest in, within the context of a struggling global economy saturated in debt. We will do our best to take advantage of sharp moves in the market! We also continue to invest back in our business hiring what we believe are the best people we can find, professionals that share the values of our organization. We now have eight full-time employees. Here is our organizational chart.
The investment team at ROCKLINC is working hard to make sure our existing companies are performing as expected or better and searching for new companies that we can add to your portfolios. Over the past 16 months, we have added several new companies to our mix. These include, Trisura Group (June 2023), Danaher Corp (August 2023), Schneider Electric (November 2023), APi Group and Cameco (both initiated in February 2024), Burford Capital (August 2024) and Markel Group (September 2024). In our ROCKLINC Partners Fund we invested in Gastronomous Technologies, a private company, in late March of this year.
During the same period, we eliminated/reduced several positions including American Tower, Honeywell International, Intercontinental Exchange, Northland Power Inc., Suncor Energy, TD Bank and TransAlta Renewable (bought out by parent company). We continue to add to businesses trading at the largest discounts to fair market value.
Within the current environment our basic strategy is as follows:
- Patience – we need to wait for well-priced opportunities. Our patience and cash positions give us the flexibility to buy low. Markets continue to trade at very high valuations
- Watch the world’s leading Central Banks. Interest rates have come down but will probably stay higher for longer while inflation remains elevated.
- Governments continue to run massive deficits that are not sustainable. This means out purchasing power will remain under pressure and standards of living will continue to drop. At some point, deficits and debts will matter and we want to be protected as much as possible from this risk. As a result, we continue to own significant positions in precious metals.
- Diversify across asset classed, sectors and geographic regions. While we run focused portfolios (20-30 securities), we are also careful to maintain an appropriate level of diversification.
- Invest in businesses with strong balance sheets, backed by hard and tangible assets with limited counterparty risk.
- Invest in firms that produce essential products and services, in growing industries, with well-established long-term secular growth trends. Our highlighted company this quarter Burford Capital is an excellent example.
- Avoid/minimize highly leveraged financialized firms that have incomprehensible balance sheets, loaded with risky derivatives. We continue to minimize our exposure to banks and life insurance companies! We have been sounding the alarm on banks for the past decade and the situation only continues to deteriorate.
- Maintain adequate liquidity in our portfolios, in order to take advantage of significant moves in the stock market. Cash is not trash when the markets become irrational! Our cash investments are earning approximately 4.25% per year
- Remain positive and opportunistic, seasoned with a dose of reality and rooted in truth.
- Place your faith and hope in God. If we have learned anything during the past 5 years it is we cannot place our faith in mankind and especially in the ever expanding Western State. We encourage our clients to reflect on the words of the prophet Isaiah in Isaiah 12:2; “Behold, God is my salvation; I will trust, and will not be afraid; for the Lord God is my strength and my song, and he has become my salvation.”
If you have any questions pertaining to your account, please call or email for an appointment.
ROCKLINC INVESTMENT PARTNERS INC.
Contact Information
ROCKLINC INVESTMENT PARTNERS INC.
4200 South Service Road, Suite 102
Burlington, Ontario
L7L 4X5
Tel: 905-631-LINC (5462)
www.ROCKLINC.com
| Doretta Amaral | damaral@rocklinc.com | (ext. 1) |
| Jonathan Wellum | jwellum@rocklinc.com | (ext. 2) |
| Jesse van de Merwe | jvandemerwe@rocklinc.com | (ext. 3) |
| Braden Van Dyk | bvandyk@rocklinc.com | (ext. 4) |
| Andrew Cheng | acheng@rocklinc.com | (ext. 5) |
| Jacob Martignago | jmartignago@rocklinc.com | (ext. 6) |
| Jonathan Wellum Jr. | jwellumjr@rocklinc.com | (ext. 7) |
| Josiah Van Gurp | jvangurp@rocklinc.com | (ext. 8) |
Disclaimer